Category Archives: Weather

Drone Sounding Prototype

Again we have a short project post in-between the posts of the open science series (part 3 coming soon)! This time I want to share a fun little project involving cheap drones and an instrument pack that I designed on top of the Light Blue Bean module. The pack uses an HTU21D temperature/humidity sensor and a BME180 pressure sensor. I designed the board in the open-source PCB/EDA tool KiCAD. Should you want to reproduce the boards, the files to send off to a board house are available on a GitHub repository here.

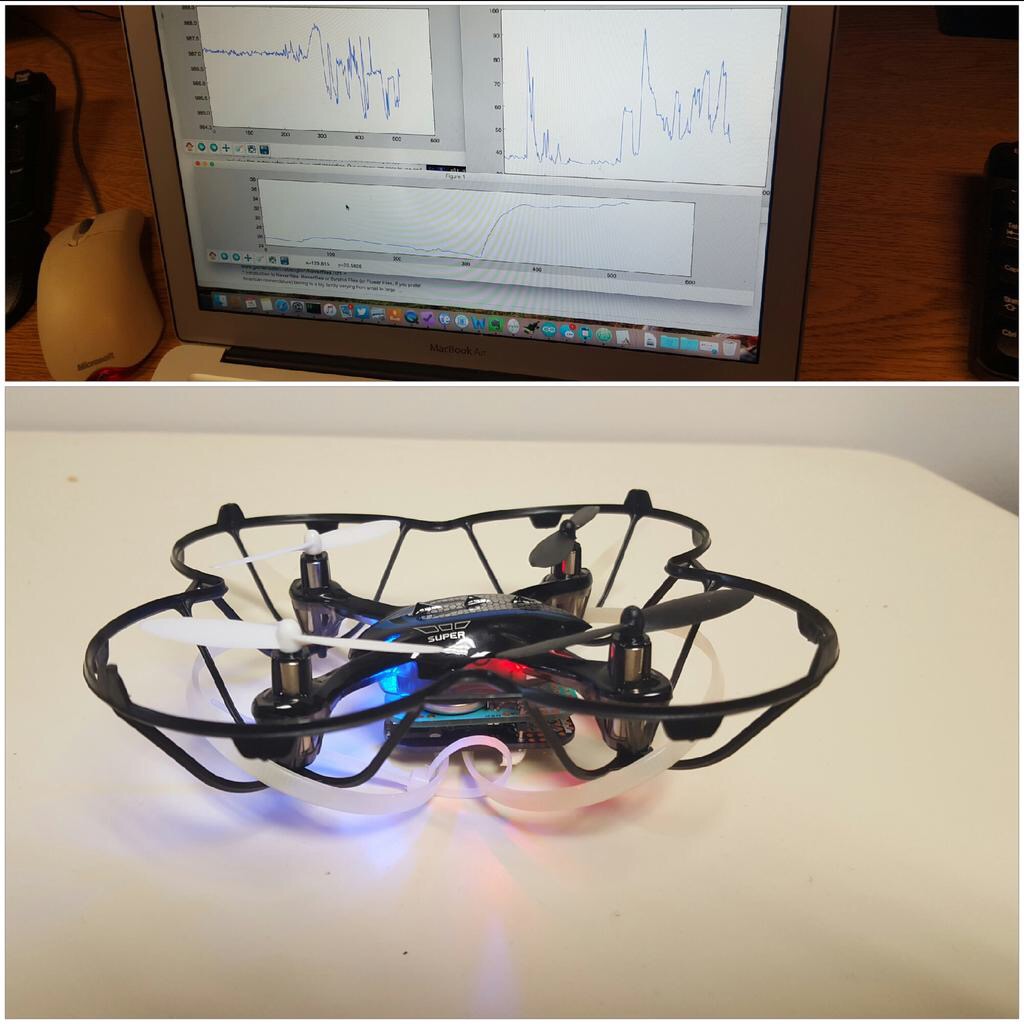
I designed the pack to be a measurement device for a home, truck, or airplane of the weather enthusiast or storm chaser. Ideally it will send the data to a smartphone/tablet that then sends it out to the web or lets you do whatever you want with it. It was also a good excuse to play with the bean after hearing about it. While delivering another product to a friend, we decided to strap this sensor to a small and cheap ($33) drone and see what happened. We got some vague data, but the drone didn't get over a few meters high due to the high load. Zip ties provided some protection on takeoff/landing.

Our initial test flight with some quick plots in the background.

Our initial test flight with some quick plots in the background.

After playing we though it would be fun to do this on a drone with some more power. I grabbed a $55 drone (Syma X5C) on eBay and gave it a shot. After a couple of test flights I just couldn't get the bluetooth link to stay connected at the distances I wanted (50m).

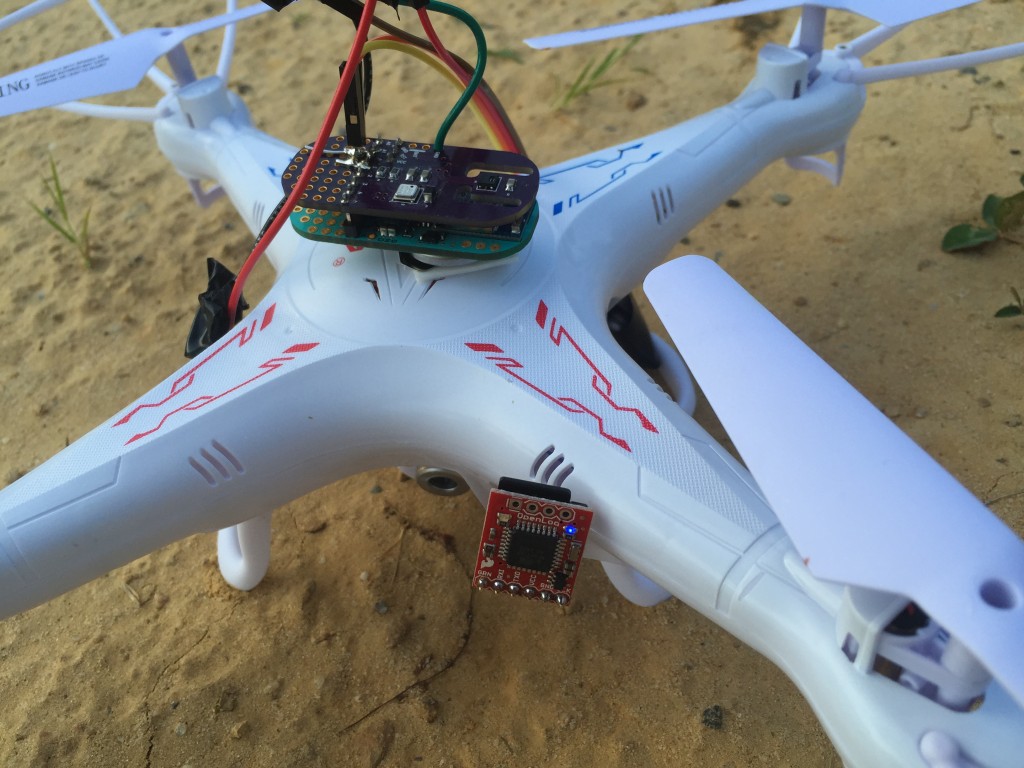
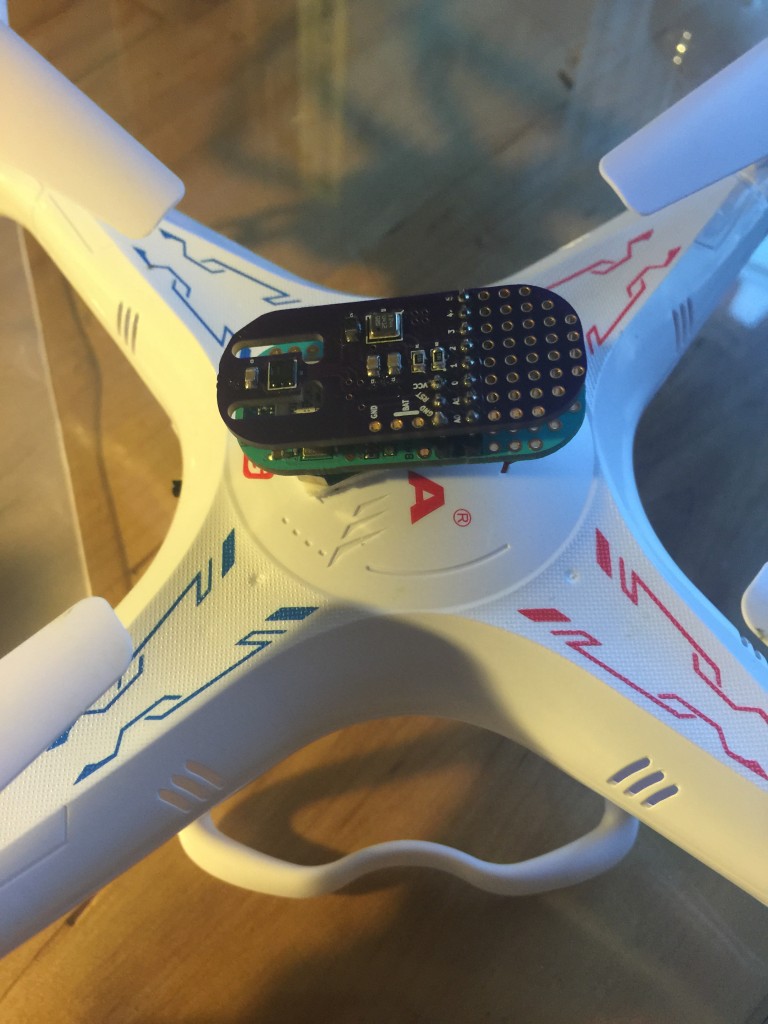
My breakout and the bean attached to the top of the drone body.

My breakout and the bean attached to the top of the drone body.

I added a kludge that wrote data to an SD card using the OpenLog. It was extra weight since I needed two more coin cell batteries, but the drone turned out to be able to carry it to 45 m once or twice. Then the drone looses signal and shakily falls out of the sky until I can get control again. While inspiring me to drool over more advanced drones, I did get some interesting data! Some of the plots are rather small in web-view, but click on them to expand. I just didn't want a bunch of individual figures making the post scroll forever.

2015-07-27 19.17.44

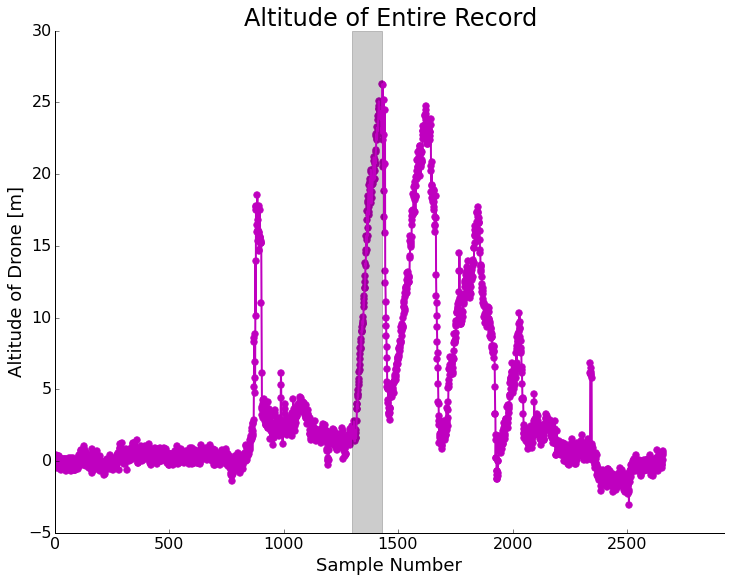
First I'll show my first SD logged flight(s). Below is the altitude plot (derived from the barometric pressure sensor on-board).

A few up/down flights of the drone. The ascent in the grey box will be examined in detail.

A few up/down flights of the drone. The ascent in the grey box will be examined in detail.

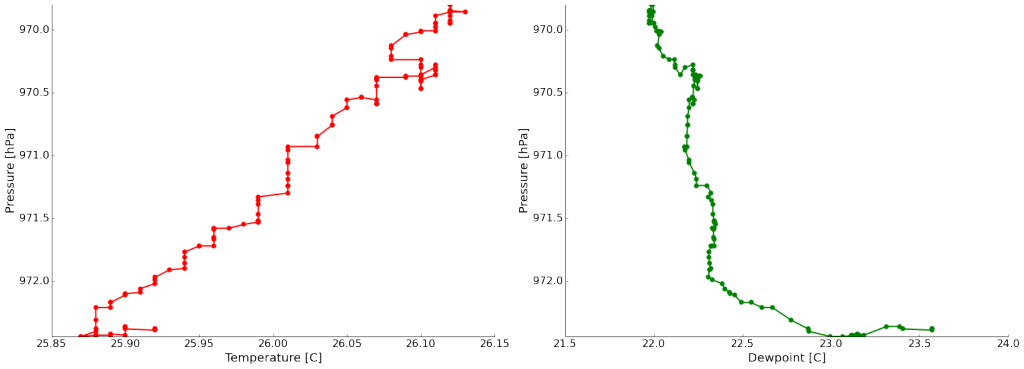
If we take the highest and most constant climb rate ascent (gray box) and look at the temperature/dewpoint data we see rather clean results!

flight1

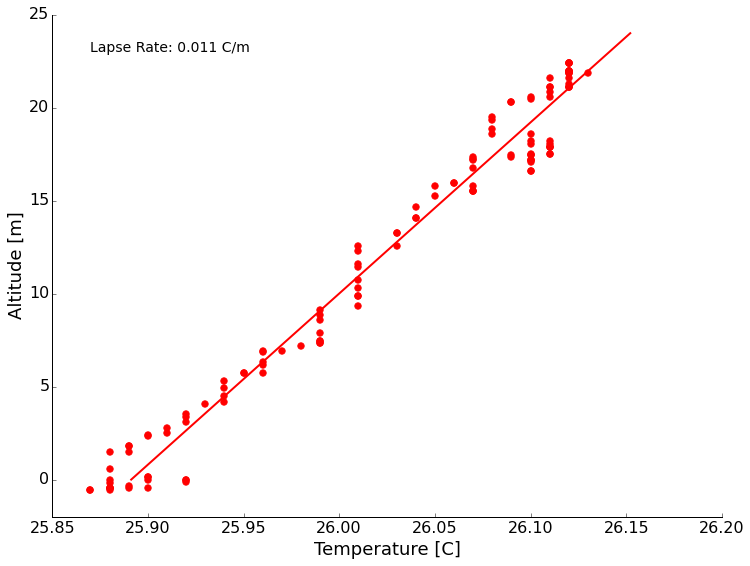
It was a dead still evening, just before sundown. Without any mechanical mixing,  we see radiation from the ground producing a temperature inversion (temperature increases with height here). We also see a nice dew point trend to drier air as we ascend. For fun, I calculated the lapse rate. This just means how fast the temperature changes with height. Plotting the data and fitting a line we get about +11 degrees/kilometer of height. A reasonable number. (Perhaps coincidentally about the negative of the typical dry adiabatic lapse rate? It's been too long and I didn't ever do much near ground meteorology. Thoughts appreciated.)

lapse_rate

The next evening, a very similar setup without wind, I did another sounding that got up to 45 meters. On this flight I noticed that the bumps in the temperature and dew point trends match rather well with the bump in my ascent rate. Since this drone isn't programmable, I do this by hand which is tricky to judge. It probably has to do with the sensors needing a lot of settling time to equilibrate to their surroundings (a couple of seconds). Maybe flying small circles on the way up is a solution. I also have the video from this flight if you're curious what it looks like. Nothing too interesting, but the uncontrolled descents are rather exciting. I've read about hacking better antennas on this drone for more range, so that's a thought. Before I get it much further away I want to do it in a large field to decrease the risk from a runaway drone. If this proves to be interesting enough, maybe a drone update will be in order. They are pricey though!

Flight 2 data

Flight 2 data

Raindrops Keep Falling on my Radar - Part 2

Last time we looked at the raindrop fall speed of raindrops during a thunderstorm and compared the radar reflected power to my observations of the storm moving through State College. Today, thanks to Yvette Richardson and Bill Syrett from the Penn State Meteorology Department, we can compare the radar returns to actual weather station data. They were able to provide data from a weather station on top of the meteorology building on campus, about 3 miles from where my radar was located.

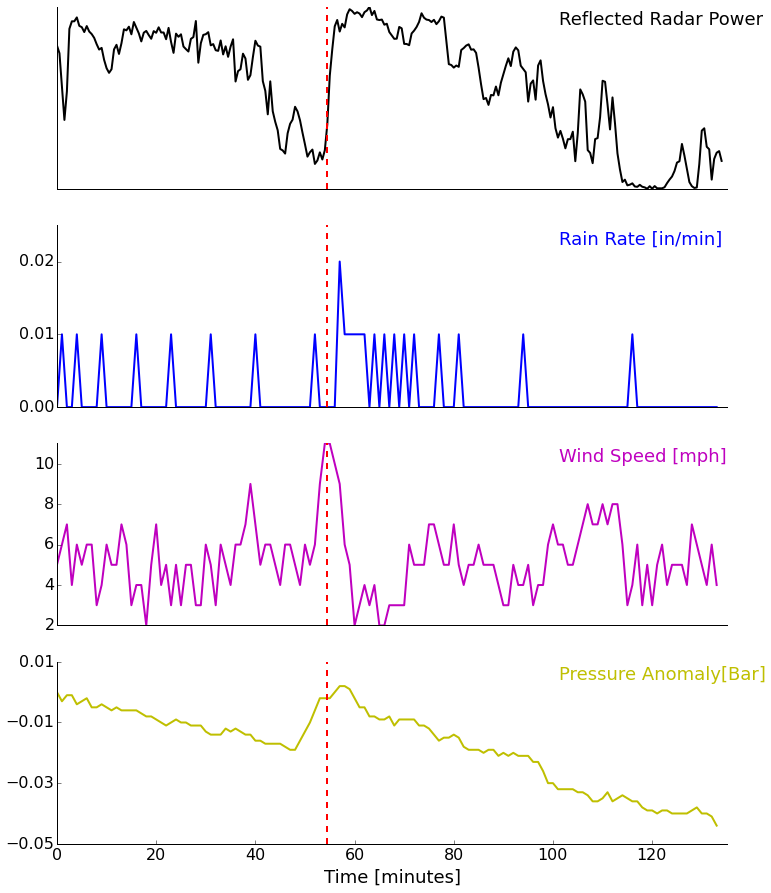
We expect more power to be returned to the radar during periods of heavy rain, so the main variable of interest is the rain rate. We'll plot up a couple of other meteorological variables just for fun as well. The weather station recorded observations every minute. I had to venture my best guess at the units based on their values. The rain rate values are low. Another station that I don't have the time-series for reported a maximum rain rate of 0.26 in/hr. Either way, let's examine the relative changes.

rain_wx_data_graph


Looking at the plot we can see that our prediction of higher rain rate equaling more reflected power holds. Unfortunately, the weather station didn't record precipitation rate with very fine resolution, so we really can only match the peak rain rate with the peak reflected power. The vertical red line marks the time of a weather service doppler radar screenshot we looked at in the last post that was right before the heaviest rain arrived. We also observe the higher wind speeds with the gust front ahead of the storm. As the storm passed over we saw decreasing pressures as well. The temperature and humidity aren't shown because they really weren't that interesting.

Now that we've verified our hypothesis (roughly anyway) about precipitation rate and radar return, we are ready to look at different types of reflectors. Next time, we will look at radar data collected during a snow storm for return intensity and the fall speed of snow flakes. That speed can be compared with video of falling snow for verification. Stay tuned!

Doppler On Wheels - A Tour of a Mobile Radar

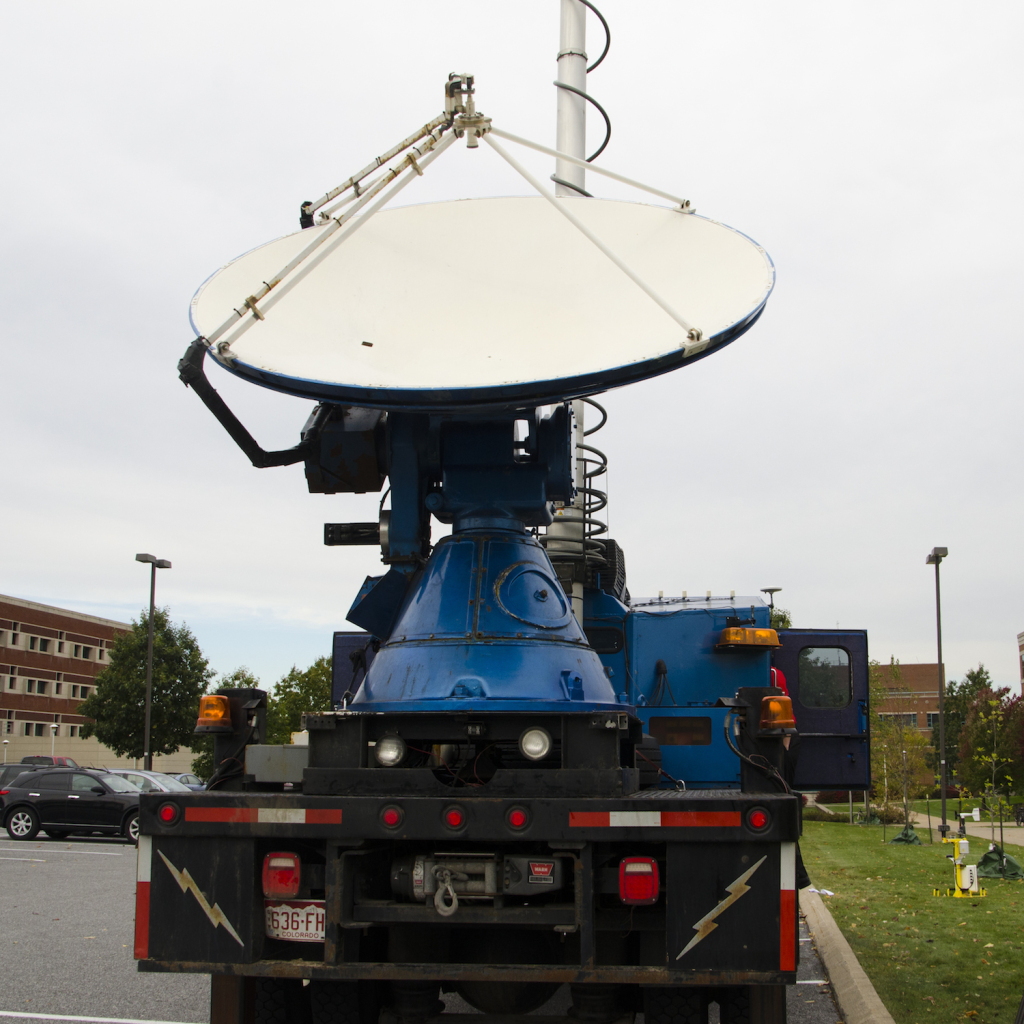
DOW7_Web

Recently, Penn State was lucky enough to have the "Doppler on Wheels" or DOW visit for two weeks through an NSF education grant! The truck, owned and operated by the Center for Severe Weather Research, is probably familiar to you if you have watched any of the storm chasing television shows or are interested in severe storms.  Dr. Yvette Richardson and Dr. Matt Kumjian were the faculty hosts and incorporated the radar into classes they are teaching.

I've always believed in getting students involved with data collection.  If students collect the data, they are attached to it and begin to see the entire scientific process.  Data doesn't just appear, real data is collected, often with complex instruments, and processed to remove various problems, corrections, etc.  It's not everyday that students get to collect data with a state-of-the-art radar though!

For this entry we're going to try a video format again.  Everyone seemed to like the last video entry (Are Rocks like Springs?).  Keep the feedback coming! It was a bit windy, but I've done what I can with the audio processing.  A big thanks to everyone who let me talk with them!  As always, keep updated on what's happening by following me on twitter (@geo_leeman).  This week I'll be off to New York to hear Edward Tufte talk about data visualization, so expect updates about that!

Exploding Ice and Rock - Booms Heard a Result of "Cryoseisms"

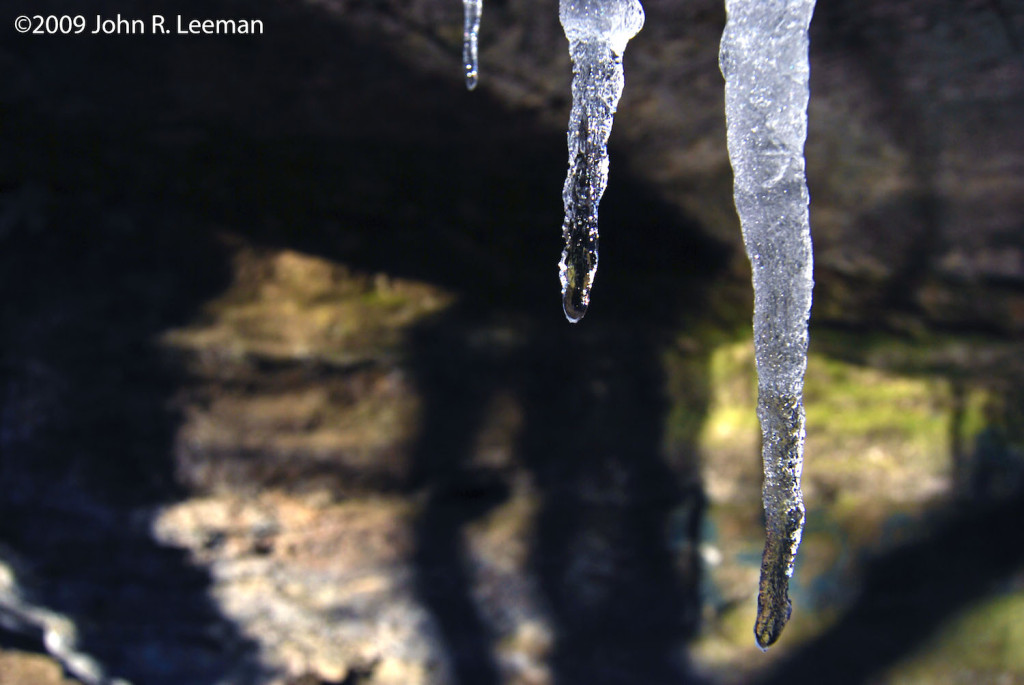
Ice Hanging From Rock

UPDATE 1/13/14: Frost-quake creates 100ft long crack here.

Over the past few days (starting around Christmas eve), there have been reports of large booming sounds associated with minor ground shaking across the northern states, as well as in Canada.  The Toronto events have a nice string of tweets that are associated with them as well.  Are these really explosions? Earthquakes? Sonic booms? The truth, as it turns out, is a rare event that produces what are known as "cryoseisms".  Oddly enough, these "frostquakes", as they are commonly known, have been discussed in the literature since about 1818!  Having a background in both meteorology and geophysics, cryoseisms are just one example of how closely related to two fields are.

So, what happens to produce such loud and potentially startling events? It's all about ice.  Cryoseisms occur when there are seasonal frost conditions, no insulating blanket of snow, lots of rain/thaw to saturate the ground, and a sharp drop in temperature.

Surface water penetrates into sufficiently permeable soil/rocks, but then is rapidly frozen with a fast drop in surface temperature.  Normally temperature drops slowly enough that the ice gradually freezes, giving the surrounding soil/rock time to adjust.  When really fast temperature drops occur and freezing is rapid, the surrounding areas are stressed by the expanding force of the ice.

The freezing process is actually a very powerful mechanism, and is one of the geologist's favorite ways to explain physical weathering of large boulders.  Freeze/thaw cycling has even been used as a quarrying technique in granite!

Expansion during this rapid freezing of infiltrated ground water stores energy in the surrounding rock/soil, like a spring, until..... BAM! Failure occurs in much the same way faults fail.  Here the driving force isn't tectonic though.

Cryoseisms can do light damage to structures in the immediate vicinity, but their intensity falls off very quickly with distance.  For the seismology buffs out there, the zero focal depth produces lots of surface waves, but these events are generally not recorded on seismic networks.

Want to know more about cryoseisms? The literature isn't too robust, but check out Barosh (2000), Nikonov (2010), and Voss & Herrmann (1980) for some starting points!

*Cryoseism is also used to refer to earthquakes at the base of glaciers as well.  That's a whole other story for another day!


Highway to Hail

On the evening of April 6th, 2010 we had a nice little storm system move through central Oklahoma.  Short term models earlier in the day were breaking out a supercell around the OKC area about sunset and though those models had done exceptionally well with events in the previous days they missed the storm type here.

On the right is a radar image from that evening where the boundary is visible.  About this time the storm was moving over Norman producing moderately high winds, heavy rain, and small hail.

Above is an image I took right before the precipitation hit Norman, as the hail began to fall I noticed that it was a prime example of what we had already been discussing in cloud physics.

Hail grows around a hail embryo.  Commonly this is graupel or large drops, but sometimes insects have become entrained in the updraft and become the center of a hailstone!  Hail can undergo 'dry' and 'wet' growth implying things about where it is in the cloud at the time.  Without going into too much detail on this we can say that dry growth produces much less dense hail (more air and cloudy looking) while wet growth produces clear layers of almost solid ice.  Switching methods of growth produces the 'onion' like texture on the inside of a hailstone that so many falsely attribute to multiple trips through the updraft.  The trajectory of most hailstones (we think) is remarkably flat!  It is rare for them to recycle through the storm and when they do its not multiple trips.

The shape of the hailstone also tells us about its environment.  There are many excellent papers out on the topic.  After looking at the image above of some hailstones collected from this storm I encourage you to read more on the topic and next time it hails be sure to pick some up and think about the environment that could have formed it.  Could this stone have recycled? Could it have been warmer than it's environment (think latent heating)? Did it melt significantly on the way down?

National Weather Festival


2009 National Weather Festival - Located here at the NWC in Norman. I ended up on KOCO thanks to Paul! The RASP instrument package and my tahoe won:

1st- Most Unique
2nd- Best Looking
2nd- Most Cutting Edge