Category Archives: Earthquake

Tracking Earthquakes Across the Globe - Travel Times

A few days ago I had the Epicentral+ app running on my iPad sitting on my desk and saw an event come on the screen. By looking at what stations were measuring ground movement first, second, third, etc. I could make a good guess at the event's location. Did you know that, with the data from a single seismic station, you can begin to guess the epicenter?

Generally earthquake locations are performed using many stations and algorithms that have been tweaked for years as we want to get ever more accurate locations. The USGS does this location for many events every day. It's fun to keep a live feed of the global seismic data up and look at the patterns. This is possible thanks to applications like "Earth Motion Monitor" and "Epicentral+", both products of Prof. Charles Ammon. They are worth installing and having a look. Prof. Ammon has seen the value in being able to watch signals for long periods of time: you begin to pick out patterns and get an intuitive feel for the response seen due to different events. While I don't have nearly the amount of insight possessed by experienced seismologists, I wanted to show you a quick and simple way to figure out about how far an event was from a given station. If you combine that with some geologic knowledge of where plate boundaries are, you can likely narrow down the region and earthquake type before anything comes out online.

The event I saw is a pretty small event, a magnitude 5.8 near the Fiji islands; it'll work for our purposes and not provide too much distraction. I've marked it with a white star on the map below (a Google Earth map with the USGS plate boundary file). This event occurred near the North New Hebrides trench, part of a slightly complex zone where the Australian plate is being pushed under, or subducted, beneath the Pacific plate.

Our earthquake in question marked with a white star near the North New Hebrides trench.

Our earthquake in question marked with a white star near the North New Hebrides trench.

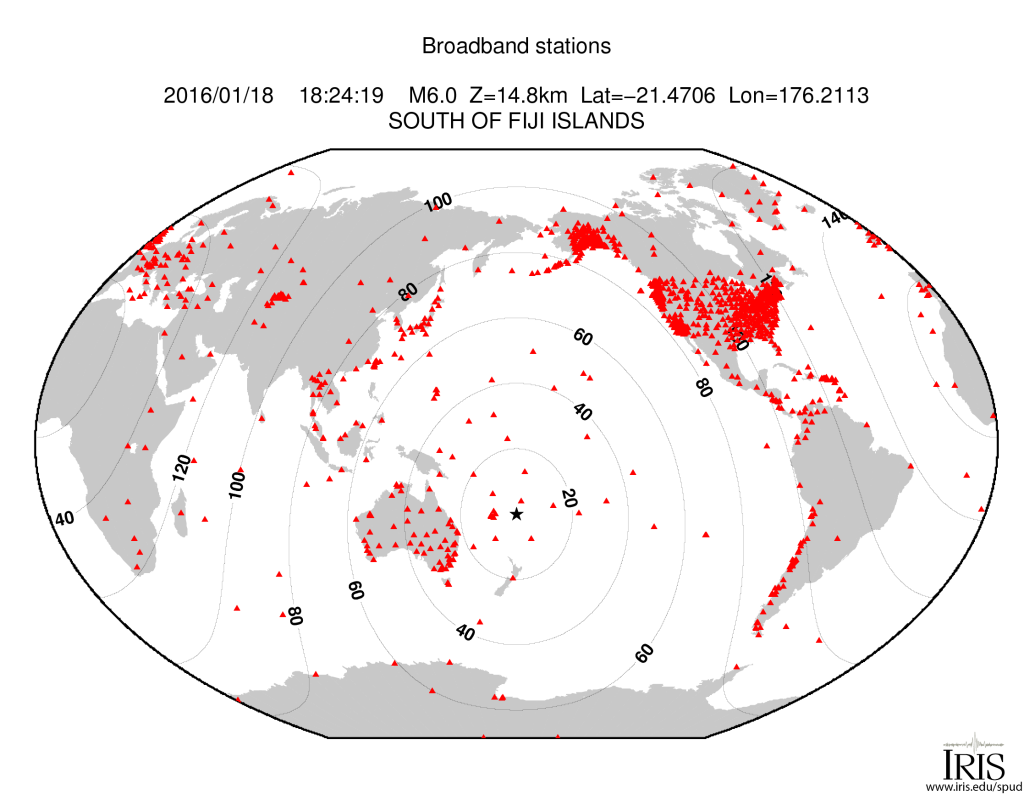
Though the event was not huge, it was detected by many seismometers around the globe. In fact, there is a handy map of the stations with adequate signal automatically generated by IRIS. The contour lines on the map show distance from the event in degrees (more on that later).

Stations and their distance from the earthquake. (Image: IRIS)

Stations and their distance from the earthquake. (Image: IRIS)

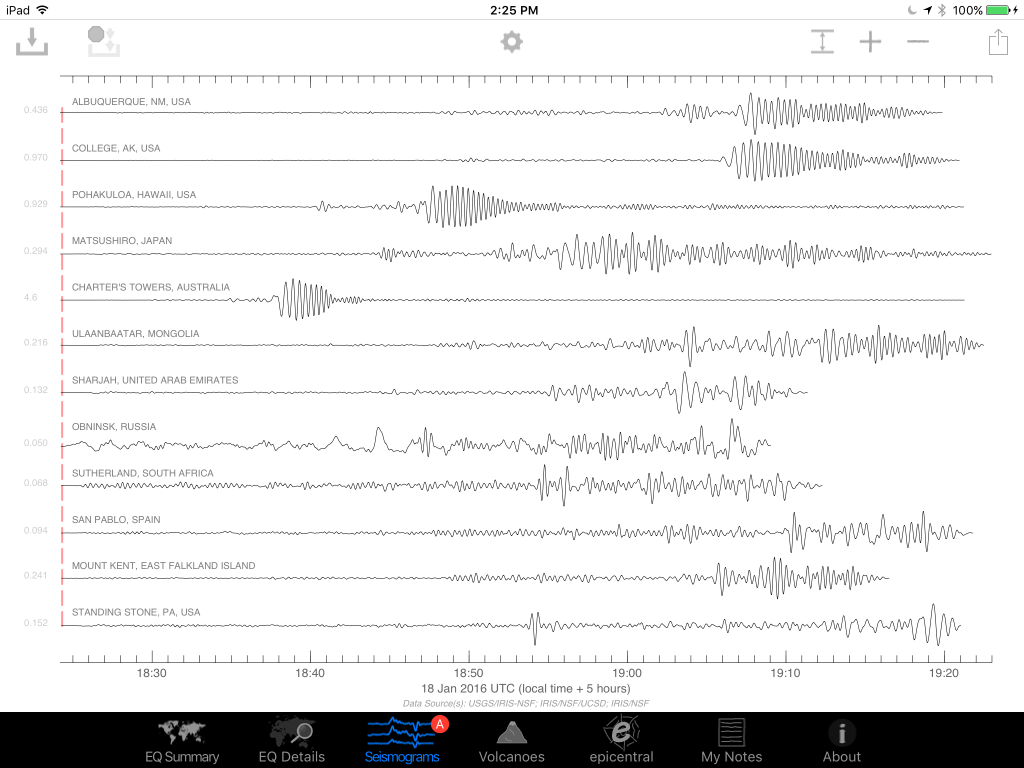
I saved an image of assorted global seismic stations about an hour after the event occurred. You can see energy from the earthquake recorded on all stations, with some really nice large packets of surface waves (the largest waves on the plot).

raw_seismograms

We're actually interested in the first two signals though, the classic P and S waves. Let's take a closer look at the station in Pohakuloa, Hawaii. We can see the first arrival, the P-wave, then a few minutes later the S-wave. The P-wave (a compressional, basically a sound-wave) travels faster than the transverse S-wave, so they arrive at different times. We know the wave speeds with depth in the Earth, so by using the difference in time between these arrivals, we can come up with a rough distance to the event.

seismograms_annotated

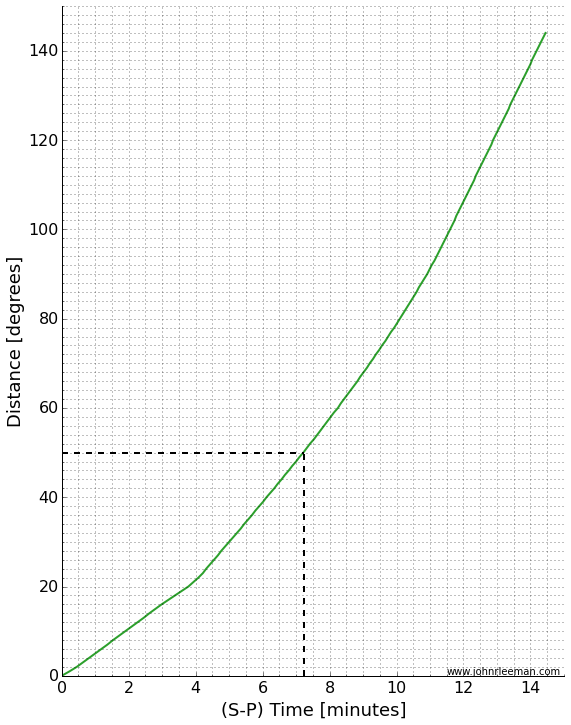
A graph of distance vs. arrival times can tell us the whole story. I've made a simple version in which you can find the time we measured (7.25 minutes) on the x-axis, then lookup the distance on the y-axis. If we do this (marked in dashed black lines), we see that the distance should be about 50 degrees.

SmP_time_curve

That's not bad! I calculated the actual distance knowing the earthquake location and station location to be 49.6 degrees. The theoretical difference in travel time based on a simple Earth model is 7.14 minutes. The slight error is due to a complex real Earth, but mostly due to me picking a rough time on an iPad screen without really zooming in on the plot. The goal was to know about how far away the earthquake was from the station though, and we did that with no problem. Just from that information it was easy to tell that the event was in the Fiji region.

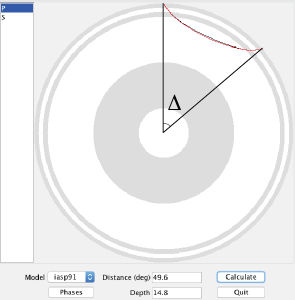
Distance is in degrees, which may seem a little strange. Since the Earth is a ball-like blob, defining distances across the surface is a little tricky when distances get large. It turns out to be more convenient to think of this distance as an angle made with the center of the earth. Take a look at the screenshot below. It's from a program called taup and shows the actual paths taken by the P and S waves through a cut-away of the Earth. I've marked the angle I'm talking about with the greek letter ∆. (We would formally say that this is the great circle arc distance in degrees. If you want to learn more about great circle arcs, you should checkout our two part podcast on map projections.)

taup_path_annotated

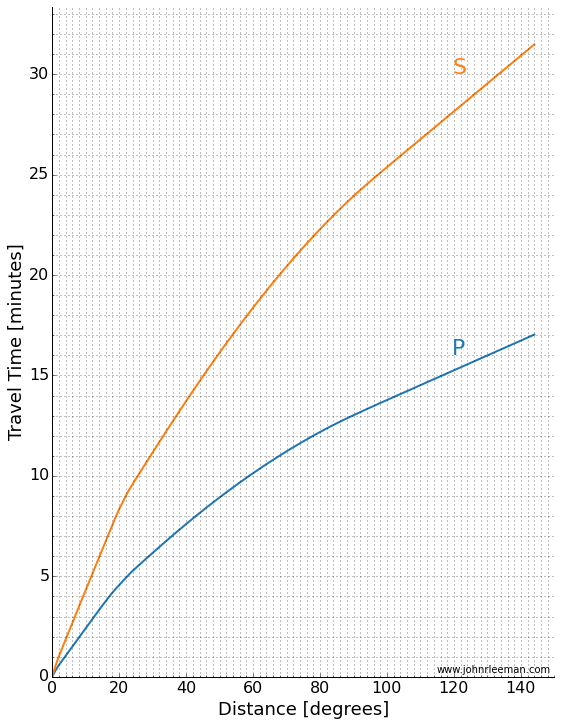
As scientists, we often look at a travel time plot a little differently. There are many different waves or "phases" that we are interested in, so plotting one line of  S-P wave arrival is rather limiting. Instead we plot a classic "travel time curve" where the arrival time after the event is plotted as a function of distance. I've reproduced one below (table of data plotted from C. Ammon).

travel_time_curve

We can make a plot like this from data too! Taking many stations, plotting them as a function of distance we get a plot like the one below. You can see curved and straight lines if you stand back and squint a little. Those are arrivals of different phases across the globe! Notice the lower curved line that matches the P-wave travel time above.
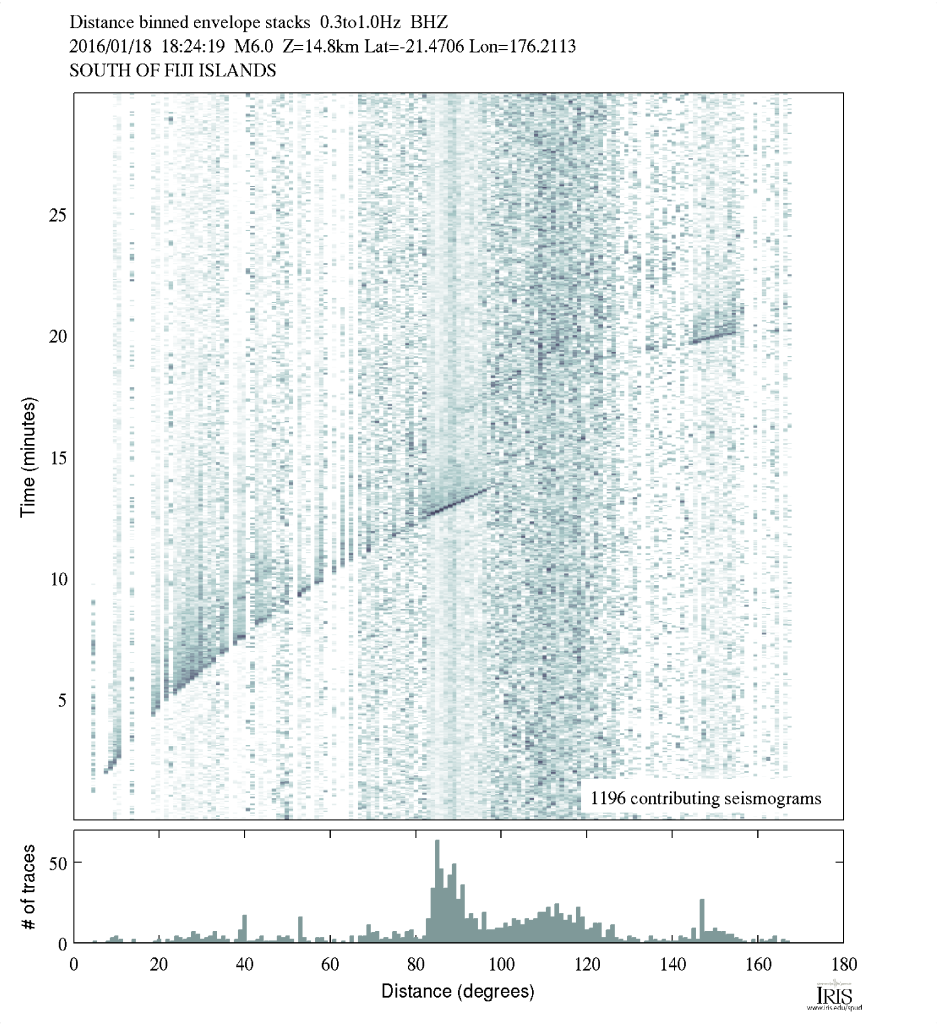
Notice the lines and curves made as different phases from the earthquake arrive across the globe. (Image: IRIS)

Notice the lines and curves made as different phases from the earthquake arrive across the globe. (Image: IRIS)

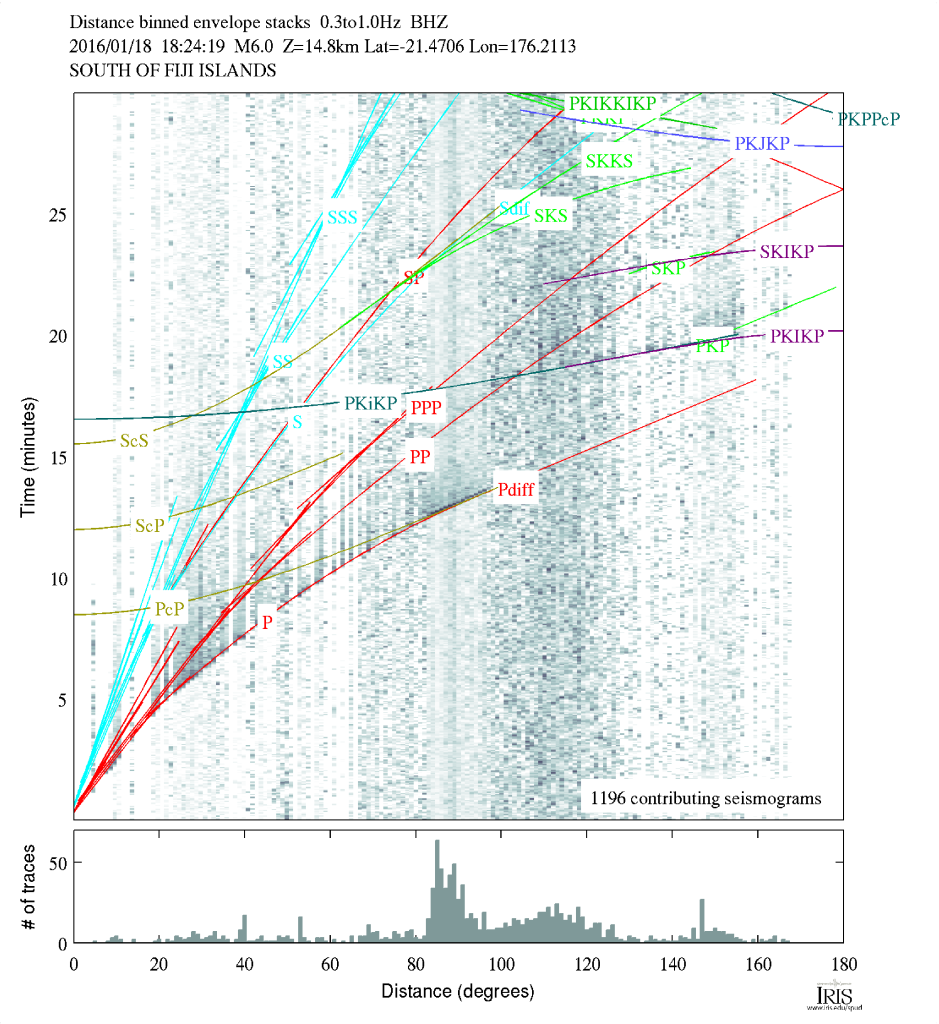
Like I mentioned, there are many different phases we can look at. To give you an idea of things a seismologist would look for, there is a version of the plot with a lot of the more complex phases marked on it below. I know it looks intimidating, but for this event, you'll see we really can't easily discern a lot of the phases. That's because this really isn't a huge event, but it's nice for us because that means the plot is easier to look at.

Arrival plot with phases marked. (Image: IRIS)

Arrival plot with phases marked. (Image: IRIS)

So there you have it, by remembering the rough travel time curves or posting one on your wall, you can quickly determine the approximate region an earthquake occurred in just by glancing at the seismograms!

Magnitude 7.1 Alaska Earthquake Visualizations

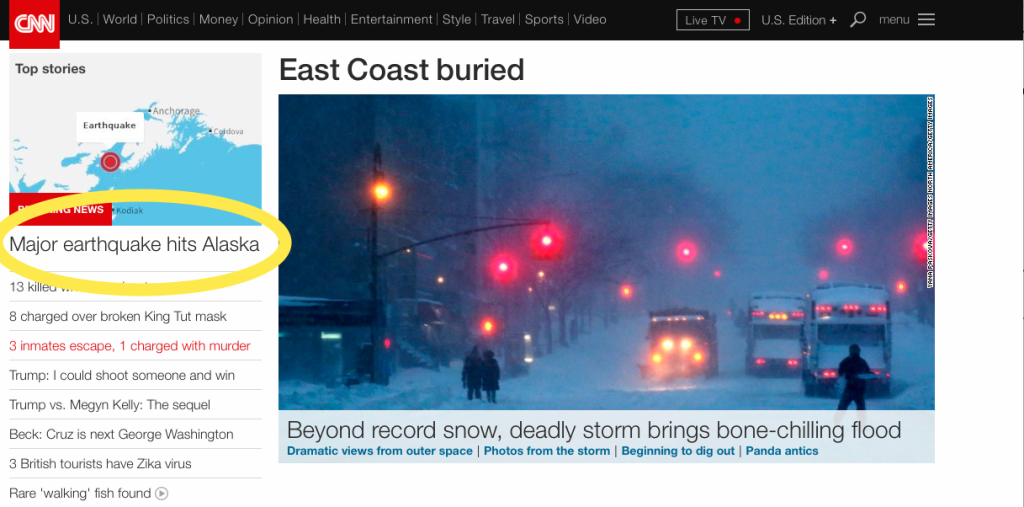
This morning there was a magnitude 7.1 earthquake beneath Alaska. Alaska is no stranger to earthquakes, and I'm not going to talk about the tectonics, but I wanted to share the ground motion videos I produced for the event. Also be sure to checkout the ground motion videos over at IRIS as well. At present no major damage or injury was reported. Though CNN did sensationalize the earthquake (as they always do):

Screenshot 2016-01-24 07.20.30

First a video from a nearby station, Homer, AK. About 8 mm maximum ground displacement with some pretty large ground accelerations.

The earthquake recorded in Australia. Not as exciting, but notice the packets of waves towards the end of the video, these are the surface waves that took the longer route around the globe compared to their earlier counter parts. (Called R1/R2 and G1/G2.)

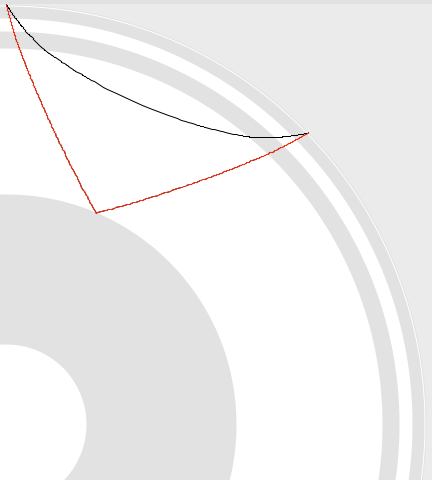
Here's a central US station near where I grew up. Nice surface waves and a good example of what looks like the PcP phase (P-wave reflected off the outer core of the planet.) The PcP phase is at about 604 seconds, around 100 seconds after the P wave. In the figure below the movie, the approximate PcP path is red, the P path is black. Pretty neat!

Screenshot 2016-01-24 13.32.59


Using Visual Mics in Geoscience

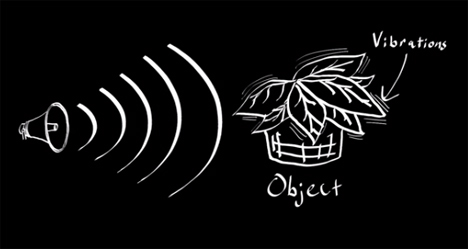
Image: TED Talk

Image: TED Talk

Last time I wrote up the basics of a tip sent in by Evan over at Agile Geoscience. This technology is very neat, if you haven't read that post first, please do and watch the TED talk. This post is going to be about how we could apply this to problems in geoscience. Some of these ideas are "low hanging fruit" that could be relatively easy to accomplish, others are in need of a few more PhD students to flesh them out. I'd love to work on it myself, but I keep hearing about this thing called graduation and think it sounds like a grand time. Maybe after graduation I can play with some of these in detail, maybe before I can just experiment around a bit.

In his email to me, Evan pointed out that this visual microphone work IS seismology of sorts. In seismology we look at the motion of the Earth with seismometers or geophones. If we have a lot of them and can look at the motion of the Earth in a lot of places over time, we can learn a lot about what it's like inside the Earth. This type of survey has been used to understand problems as big as the structure of the Earth and as small as finding artifacts or oil in shallow deposits. In (very) general terms we look at very low frequency waves for Earth structure problems with periods of a second to a few hundred seconds. For more near surface problems we may look at signals up to a few hundred cycles per second (Hz). Remember in the last post I said that we collect audio data at around 44,200 Hz? That's because as humans we are able to hear up to around 20,000 Hz. All of this is a lot higher frequency than we ever use in geoscience... I'm thinking that makes this technique somewhat easier to apply and maybe even able to use poor quality images.

So what could it be used for? Below are a few bullet points  of ideas. Please add to them in the comments or tear them apart. I agree with Evan that there is some great potential here.

  • Find/visualize/simulate stress and strain concentration in heterogeneous materials.
  • Extract modulus of rock from video of compression tests. Could be as simple as stepping on the rock.
  • Extend the model to add predicted failure and show expected strain right before failure.
  • Look at a sample from multiple camera views and combine for the full anisotropic properties. This smells of some modification of structure from motion techniques.
  • Characterize complicated machines stiffness/strain to correct for it when reducing experimental data without complex models for the machine.
  • Try prediction of building response during shaking.
  • What about perturbing bodies of water and modeling the wave-field?

With everything in science, engineering, and life, there are tradeoffs. What are the catches here? Well, the resolution is pretty good, but may not be good enough for the small differences in properties we sometimes deal with. In translating this over to work on seismic data I think a lot of algorithm changes would have to happen that may end up making it about the same utility as our first-principles approaches. A big limitation for earthquake science is what happens at large strains. The model looks at small strains/vibrations to model linear elastic behavior. That's like stretching a spring and letting it spring back (remember Hooke's Law?). Things get interesting in the non-linear part of deformation when we permanently deform things. Imagine that you stretch the spring above much further than it was designed to be. The nice linear-elastic behavior would go away and plastic deformation would start. You'd deform the spring and it wouldn't ever spring back the same way it was again. Eventually, as you keep stretching, the spring would break. The non-linear parts of deformation are really important to us in earthquake science for obvious reasons. For active seismic survey people, the small strain approximation isn't bad though.

Another issue I can imagine is combining video from different orientations to recover the full behavior of the material. I don't know all of the details of Abe's algorithm, but I think it would have problems with anisotropic materials. Those are materials that behave differently in different directions. Imagine a cube that can be easily squeezed on two opposing faces, but not easily squeezed on the others. Some rocks behave in such a way (layered rocks in particular). That's really important since they are also common rocks for hydrocarbon operations to target! Surrounding the sample area with different views (video or seismic) and using all of that information should do the job, but it's bound to be pretty tricky.

The last thing that strikes me is processing time. I don't think I've seen any quotes of how long the processing of the video clips took to recover the audio. While I don't think it's ludicrous, I think the short clips could conceivably take a few hours per every 10 seconds (this is a guess). For large or long duration geo experiments that could become an issue.

So what's the end story? Well, I think this is a technology that we haven't seen the last of. The techniques are only going to get better and processors faster to let us do more number crunching. I'm curious to watch this develop and try to apply it in some basic experiments and see what happens. What would you try this technique on? Leave it in the comments!

Nepal Earthquake Ground Motion Around the World

The recent earthquake in Nepal is truly a tragic event. Currently it has claimed over 5000 lives and the more remote regions will not be reached for days to weeks. It is really very hard to comprehend the intensity of ground motion for such an event. If you want to know more technical details about the event, I encourage you to look at the official USGS event page and Chuck Ammon's blog post. We also will talk about earthquake details on the "Don't Panic Geocast" tomorrow (Friday).

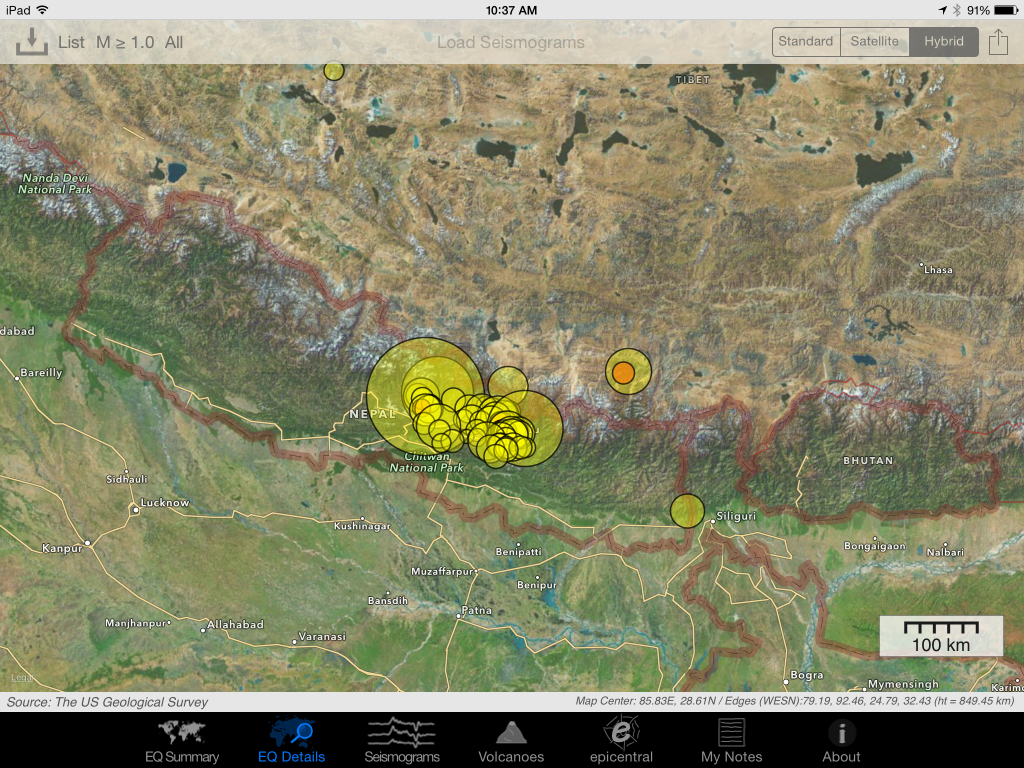
For now I wanted to share some animations of the ground motion associated with the event. I tweeted some of these earlier in the week and got a great response, so I wanted to collect them all in one place with some maps. First off a quick map of the main shock and many aftershocks (circle area goes with the magnitude, color the age).

2015-04-30 10.37.19

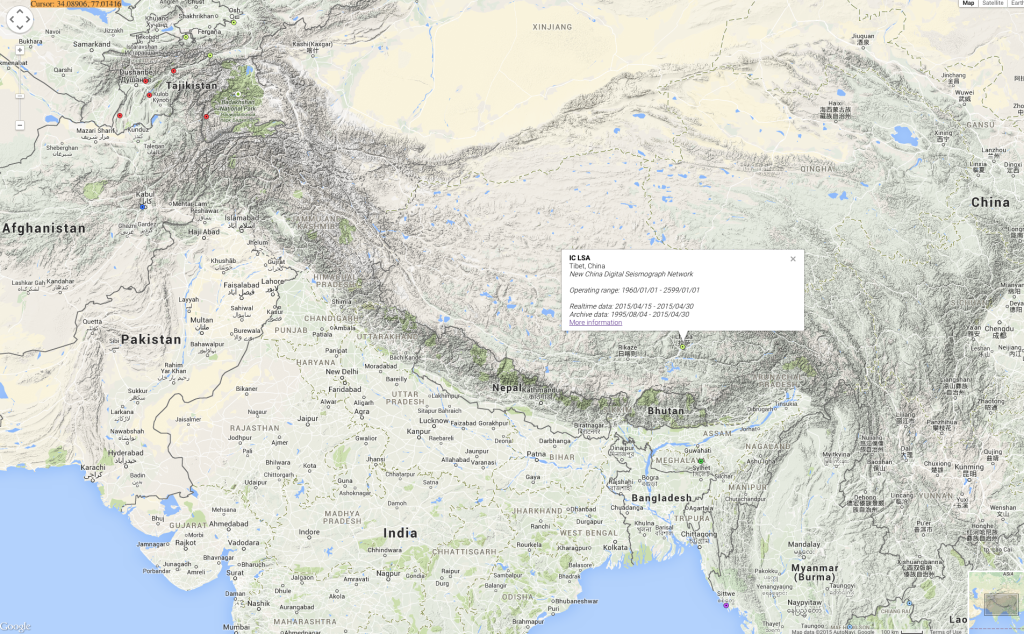
Let's start with a ground motion visualization from a station in Tibet, China. This station "clipped". This means the instrument hit the limits of the motion it could measure. This particular station is about 650 km (400 miles) from the earthquake. There is another instrument that measures strong motion closer to the earthquake, but the data had some holes that made animation very difficult. (I guess that's another feature to add to the program!)

Screen Shot 2015-04-30 at 10.40.56 AM

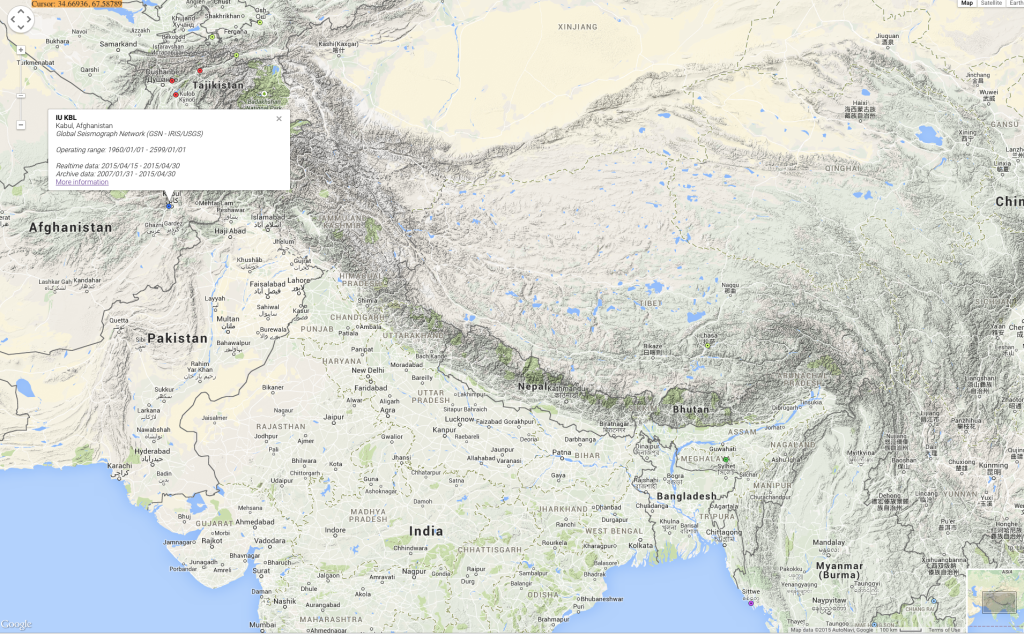
Next, we look a little further away at Kabul. While the shaking wasn't very strong (much smaller accelerations), we begin to see more interesting waveforms as phases are getting separated by traveling a greater distance of 1650 km (1025 mi).

Screen Shot 2015-04-30 at 10.41.07 AM

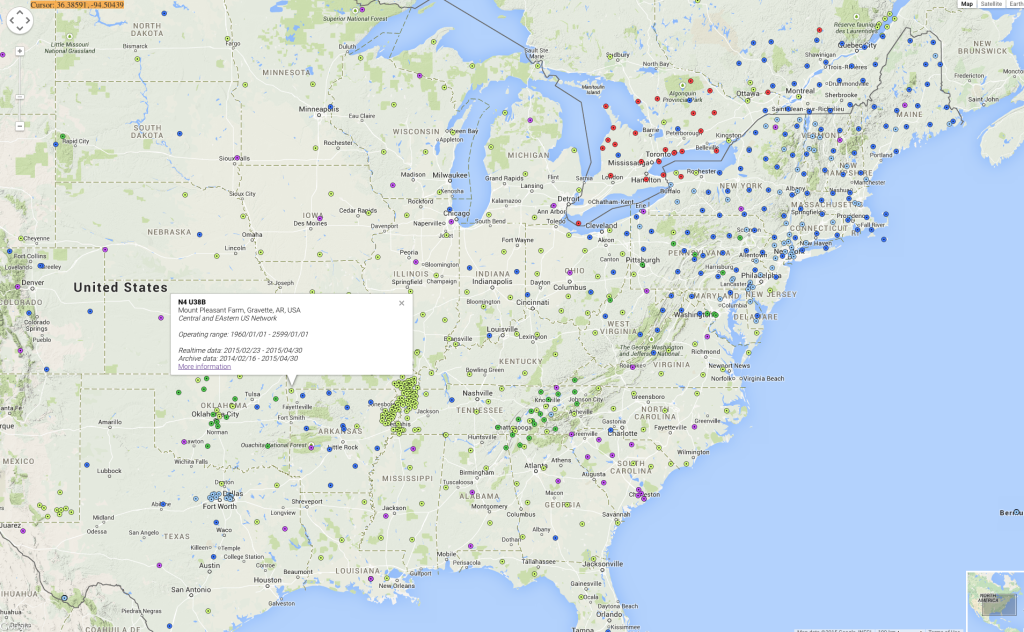
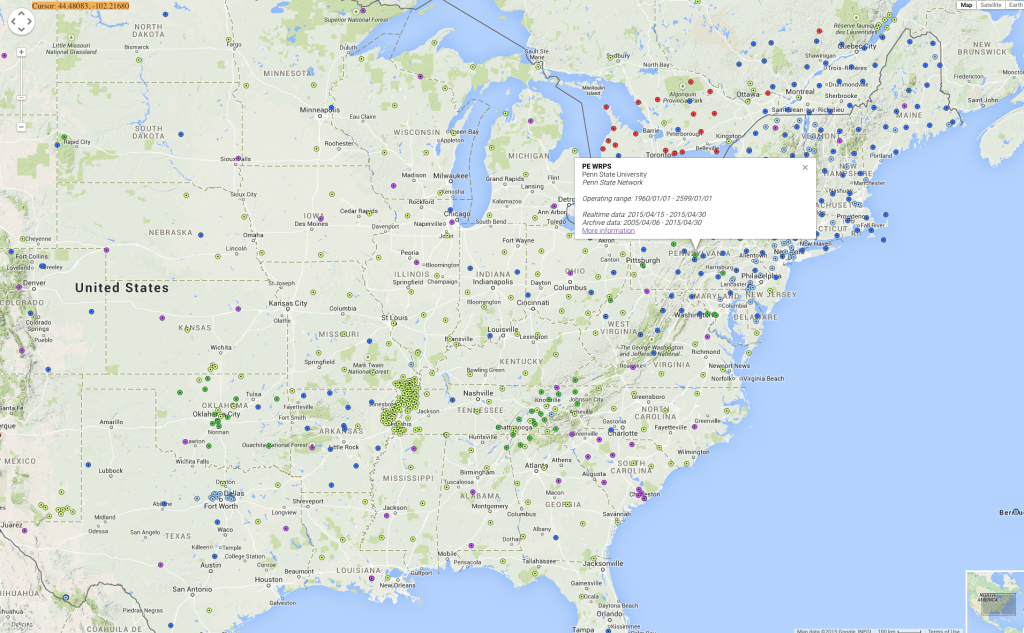
If we move much further away to the U.S., we see a very long record of motion. I made two animations for the U.S., one near where I grew up in Arkansas and one from the instrument in the basement of the geology building here at Penn State. There are some really great Rayleigh waves (the circular motion) around 3:51 in the Arkansas video and 3:18 in the Pennsylvania video.

Screen Shot 2015-04-30 at 10.41.36 AM

Screen Shot 2015-04-30 at 10.41.44 AM

I hope you find these videos interesting! There is a lot of possible post material in each one, but I wanted to be sure to get them out in a timely and collected way. The program to make these is completely open source on GitHub: https://github.com/jrleeman/SeismoVisualize and was inspired by the visualization of Mike Cleveland and Chuck Ammon.

Napa Valley Earthquake - Aug. 24, 2014

As I'm sure you've heard/read by now, there was a moderate earthquake in the Napa Valley region of California earlier today. At 3:20 AM a fault ruptured producing a magnitude 6.0, the largest for that area since 1989. So far the damage pictures I've seen coming out of the area show moderate to severe structure damage on older structures and lots of toppled book shelves and wine racks.

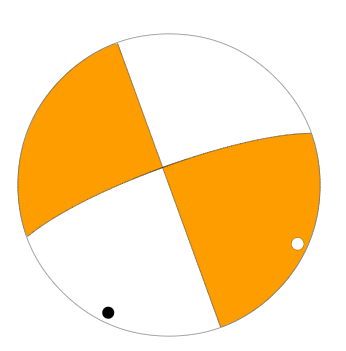
This earthquake has nearly a textbook slip pattern or focal mechanism. The plot below is often called the "beach ball plot" and is a way to represent how the fault moved. Without going into the details of how we construct a plot like this, we can simply interpret what we see. This plot shows a traditional strike-slip motion. This means that the plates slid past each other laterally with little motion up and down on the fault. This doesn't mean that there will be no up and down motion as the seismic waves propagate though!

Focal Mechanism Solution (usgs.gov)

Focal Mechanism Solution (usgs.gov)

We can also interpret from this beach ball that the strike-slip motion was right-lateral. If we were standing out in the ocean looking towards the other side of the fault inland California, we would see things shift to the right. This makes sense with the tectonics there as the pacific plate is grinding northwest past the North American plate. The locked plates bend and deform storing elastic strain energy, then finally fail, snapping into a state of lower stress. I've shown this elastic property of rocks before, but we have yet to really discuss the earthquake cycle in detail. Maybe one day soon I'll do some demonstrations about that though!

The final piece of the earthquake story I want to show you is a movie of the ground motion experienced at a seismometer in the Marconi Conference Center, Marshall, CA. This video shows what we would see if we could track a piece of the ground in 3D and watch it's motion as different seismic waves go by. There is lots of information in this plot, but for now just notice the large amounts of motion!  This is three minutes of data with 4 ground positions recorded per second in real time, then sped up.

As always, if you do happen to live in an earthquake prone area, be sure to have a plan, have an emergency kit, and always be prepared for any natural disaster!


Are Rocks like Springs? A Video Demonstration

Today I was getting a demo in the lab ready for a tour group and decided to try shooting a quick, unscripted bit on rocks as springs.  There are a few generalized statements in here, but overall it is a first try at a public education video.  Comments welcome!

Exploring Scientific Computing at SciPy 2014

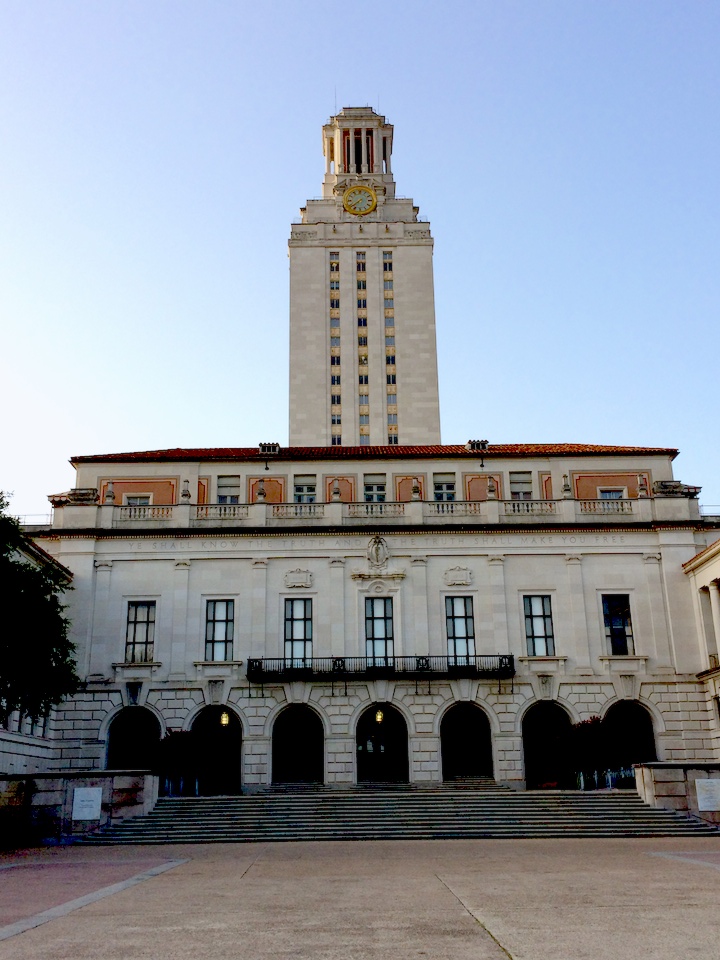
Texas Campus

This past week I've been in Austin, TX attending SciPy 2014, the scientific Python conference.  I came in 2010 for the first time, but hadn't been able to make it back again until this year.  I love this conference because it gives me the chance to step away from work on my PhD and distractions of hobby projections to focus on keeping up with the world of scientific computing with Python.  I try to walk the fine line between being a researcher, engineer, and programmer everyday.  That means that it is easy to fall behind the state of the art in any one of those, and conferences like this are my way to getting a chance to learn from the best.

SciPy consists of tutorials, the conference, and sprints:

The first two days were tutorials in which I got to learn about using interactive widgets in iPython notebooks, reproducible science, image processing, and Bayesian analysis.  I see lots of things that I can apply in my research and teaching workflows!  Interactive notebooks are one of the last things that I was wishing for from the Mathematica notebooks.

The next three days were talks in which we got to see the newest software developments and creative applications of Python to scientific problems.  I, of course, gravitated to the geophysics oriented talks and even ran into some people with common connections.  It was during the conference that I gave my poster presentation.  I knew that the poster focused more on the application of Python to earthquake science than any earth-shaking (pun-intended) software development.  There were a few on the software side that wondered why I was there (as expected), but the poster was generally very well received.  Again I had several chance encounters with people from Google and other companies that had similar backgrounds or were just very interested in earthquakes!

The final two days (I'm writing this on the last day) were sprints.  These are large pushes to further develop the software while a critical mass of experts are in one location.  I'm still new enough to these massive open-source projections (on the development side at least) that I wasn't incredibly useful, but the reception of the developers was great!  Everyone was excited if you wanted to help and would spend as much time as needed to get you up and running.  During the sprints I've been following a fix for an issue that has recently caused problems in my plotting.  I also fixed a tiny issue (with help) and had my first pull request accepted.  For software people these are tiny steps, but for someone coming from just developing in-house purpose-designed tools.... it was an hit of the open-source collaboration drug.

Lastly, I worked on a project of my own during the evenings.  During the 2010 conference I worked with a friend to make a filter remove the annoying vuvuzela sound from the World Cup audio.  This year I've been making a fun earthquake visualization tool.  You'll be seeing it here on the blog, and may have already seen it if you follow me on twitter.  I learned a lot during this year's SciPy 2014, got to spend time with other alums of OU Meteorology, and meet some new folks.  Next on the blog we'll be back to some radar or maybe a quick earthquake discussion!

It's All About the Waves - 2014's First Magnitude 7+ Event in Chile

There's been a decent amount of chatter amongst Earth scientists that it has been a long time since the last magnitude 7 or greater earthquake.  In fact, there hadn't even been one in 2014 until last night.  The earthquake is currently rated an 8.2 (mww) and occurred in a well known seismic gap that has been published on a decent amount in recent years.  The last major earthquake in North Chile was an 8.6 in 1877! Many smaller earthquakes in the area over the last weeks have kept everyone on their toes.

This location in Chile marks a major plate boundary where the Nazca plate is subducting, or being pushed under the South American plate.  The idea of subduction is that the two plates are being forced together and one ends up getting pushed underneath the other.  In this case, the cold and dense oceanic crust gets pushed underneath the less dense continental crust.  As we would expect, this means that the earthquakes occur on a very shallow angle thrust.  Moment tensor solutions can tell us about the fault by analyzing many seismograms.  Turns out that the moment tensor solution looks like about a 12-18 degree dip on the fault, not out of line with our prediction.  There are a lot more of the advanced scientific products such as the moment rate function here.  It looks like the rupture lasted for around 100 seconds and slipped a maximum of 6.5 meters (21 ft.) at a depth of near 30 km (18.6 miles).  The earthquake started a little more shallow though, about 20 km (12 miles) down.

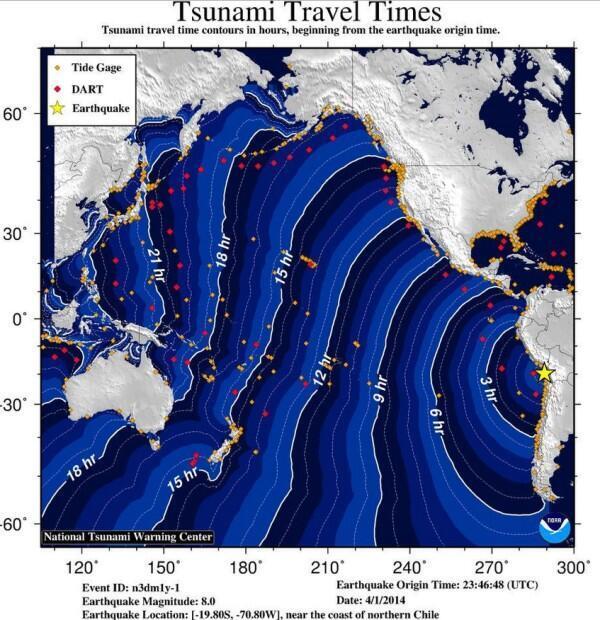
There have been many aftershocks with the event, some sizable.  At the bottom of the post I've provided a channel list that I'm using to watch the aftershock sequence on the EpiCentral app (for iPad).  What I want to show are the buoy data though!  When a large earthquake of this type occurs, waves are generated in the ocean and the folks at the Pacific Tsunami Warning Center go into action.  There were some significant waves near Chile (about 2m/6.5 ft.).  It looks like, for the time being, most other locations such as Hawaii may be in the clear.  As I'm writing this the remnants of the waves should reach Hawaii in the next few hours.  Below is a rough travel time map from NOAA.

ChileTsunamiTravelTime

A list of the observations from the  warning center can be found in their most recent statement.  We can actually access the buoy data and look at the wave propagating across the ocean though!

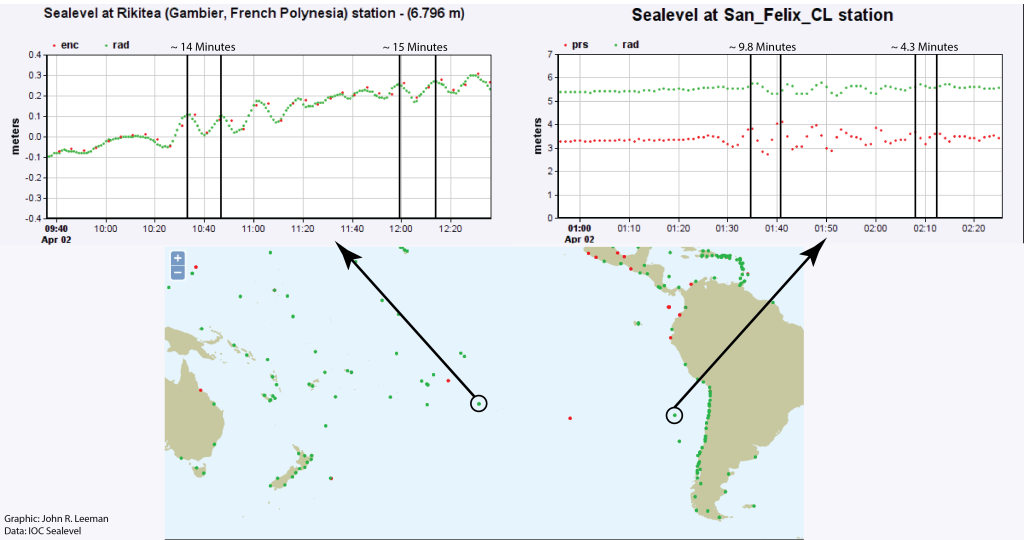
When waves propagate across the water (or many other media) they often experience a phenomena called dispersion.  The idea is that waves are actually made of many frequency components, or notes if you will.  Because of some physics funny business, the longer period (lower frequency) waves will actually travel faster than the short period (high frequency) waves.  We can see this in the data below.  I'm showing two stations for sealevel.  They have different types of sensors, but that's not too important.  Be sure to click on the plot to see it full size (the link will open in a new window/tab)!

Wave_dispersion

We see exactly what theory predicts, long period waves coming in first, followed by progressively shorter period waves.  We also see that stations further out don't see the high frequency waves.  This is another phenomena in which the medium filters out high frequency waves over the travel.  We would say that the high frequency waves have been strongly attenuated.

That's all for now! Thank you for sticking with me through some interesting observations of predictions from math and physics!

Channel List:
C;GO01; --;BHZ;VERTICAL,CHUSMIZA, CHILE
C;GO01; --;BHE;EAST-WEST, CHUSMIZA, CHILE
C;GO01; --;BHN;NORTH-SOUTH, CHUSMIZA, CHILE
IU;LVC; 00;BHZ;VERTICAL, LIMON VERDE, CHILE
IU;LVC; 00;BHE;EAST-WEST, LIMON VERDE, CHILE
IU;LVC; 00;BHN;NORTH-SOUTH, LIMON VERDE, CHILE
C;GO02; --;BHZ;VERTICAL,MINA GUANACO, CHILE
C;GO02; --;BHE;EAST-WEST, MINA GUANACO, CHILE
C;GO02; --;BHN;NORTH-SOUTH, MINA GUANACO, CHILE

The Harlem Shake: Seismometer Records NY Building Explosion

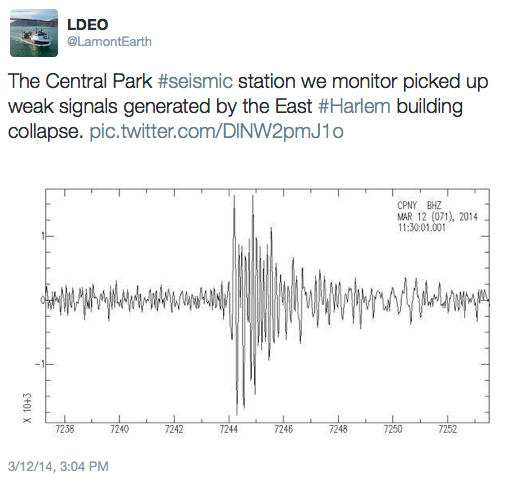
Early this morning a large boom resounded throughout east Harlem as what is believed to be a gas explosion occurred at 1644 Park Avenue.  The five story building that was at that location, and its neighbor building, collapsed as a result of the explosion.  There were even reports of the shaking jamming doors in nearby structures.

The Lamont-Doherty observatory posted the following on Twitter, showing a plot of the event recorded on the Central Park station.  I haven't looked around to see if I can find it on any other stations to do a similar exercise as the Russian meteorite explosion, but I doubt there is enough data.

Screen Shot 2014-03-12 at 3.53.16 PM


As always, don't forget to follow the observatory (@LamontEarth) and me (@geo_leeman) on twitter!

20 Years Since Northridge

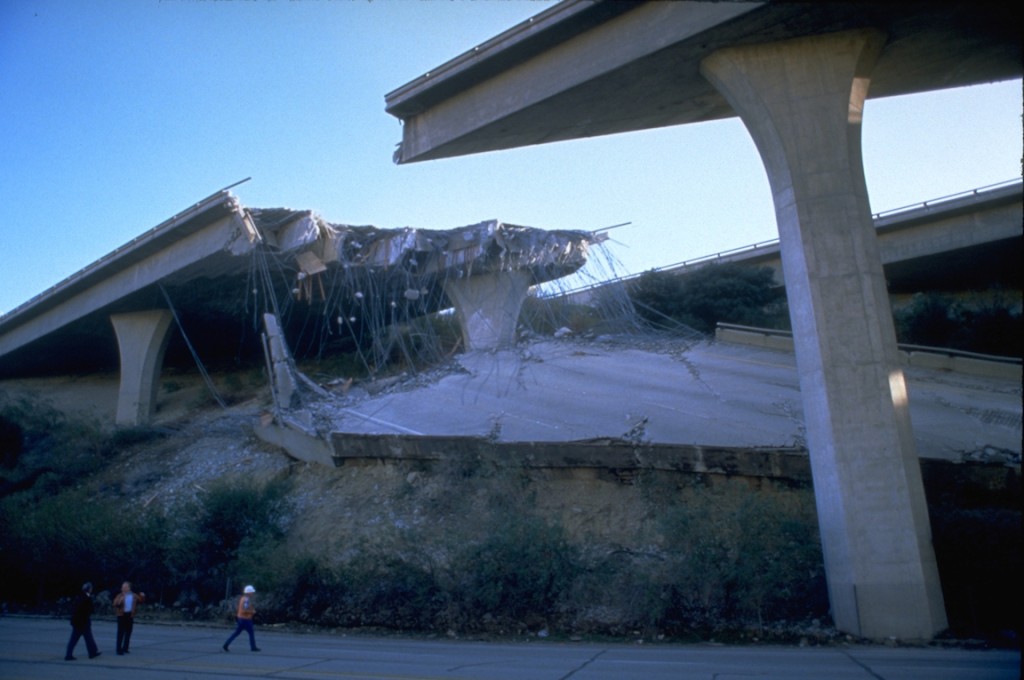
FEMA_-_1807_-_Photograph_by_Robert_A._Eplett_taken_on_01-17-1994_in_California

Today marks 20 years since the famous Mw 6.7 Northridge earthquake.  In the early morning hours the earthquake hit the San Fernando Valley region of California and caused massive destruction.  In the 20 seconds of shaking there were around 60 deaths and over 8,700 injuries.

While the magnitude is strong, it really isn't that impressive.  What is impressive about this event is the accelerations and velocities involved.  The ground acceleration was up to 1.8g (~54 feet/second^2) and the peak ground velocity was the highest ever recorded at just over 6 feet/second (1.83m/s)!

Without going into all the details of the earthquake that are easily available, I would rather provide a news clip of the evening after the event and ask a question.  If you live in an earthquake prone region, do you have a disaster plan?

As you can see in the video, when gas mains are snapped and fires start there are only minutes to evacuate.  Take some time and put together a survival bag as well as talk to your family (especially children) about what to do during a disaster.  Even if you don't live in an area with significant earthquake hazard this is important to do with the upcoming severe weather season.  Some helpful links are provided at the bottom!

http://youtu.be/8Xg_mhA4ffA

Links

American Red Cross Survival Kit
Ready.gov Survival Kit
CDC Earthquake Health Information
FEMA Ready.gov  Earthquake Information
Earthquake Safety at Work