In the past on the "Don't Panic Geocast" we've talked about the speed of sound varying with temperature and how that can cause sound waves to bend. This phenomena, known as refraction, can result in all kinds of weird events, like being able to hear things from very far away when a thermal inversion is present in the atmosphere.
As I was researching some for that episode, I found that the standard formula for the speed of sound with temperature is a nice simple linear function over the ranges we care about. True, pressure and humidity can factor in there, but for simplicity, let's consider the largest factor... Temperature.
The formula above means that the speed of sound varies with temperature by 0.6 meters/second for every degree celsius of temperature change. That's about 2 ft/s for those of us more used to imperial units. A change that large should be pretty easy to see, right? This experiment and post were born from that statement.
To measure the speed of sound, I had several ideas. I could generate a short burst of noise and using an oscilloscope time how long it took to get to a microphone. That would require me to manually make the measurements, which probably means not a ton of data points since I'd have to either use the refrigerator to get a temperature difference or sit outside for a day. Neither of those were appealing. I ended up remembering some hardware that I had sitting around from the ultrasonic cave profiler.
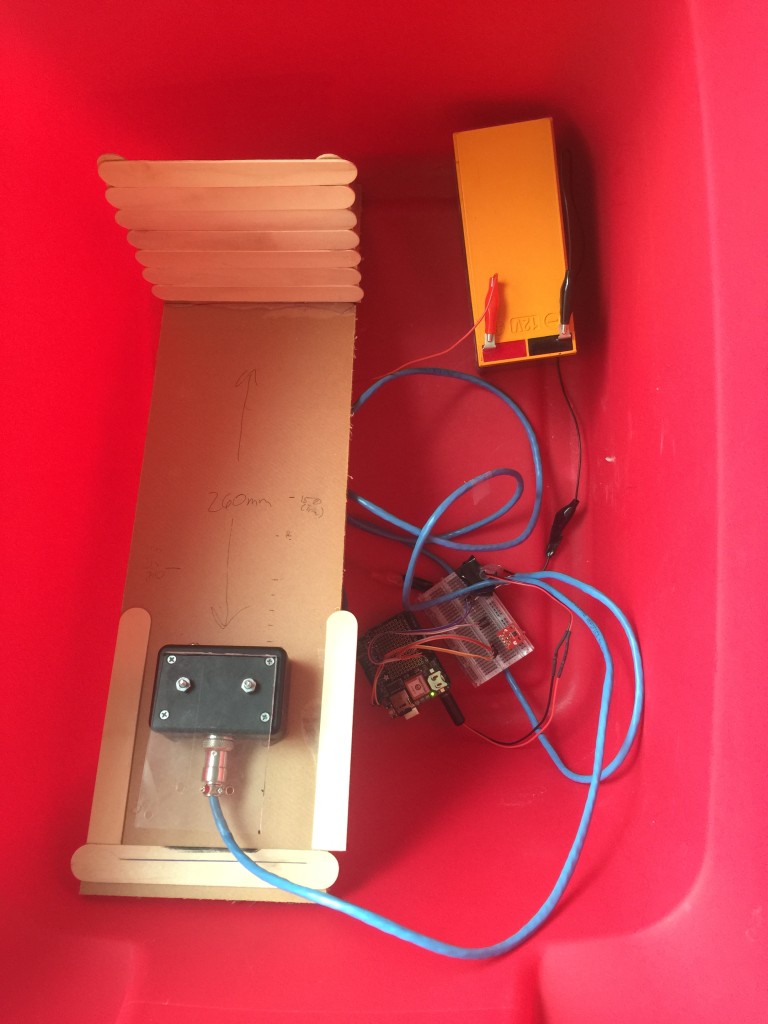
The part of interest is the ultrasonic ranger. This little device (an SRF05) sends out a packet of ultrasonic pings and listens for their return. The device lets us know how long this takes by toggling an output from a digital 1 to digital 0. I already had the code to run this sensor, so I was half way there! The next thing I needed was a way to log the data. I didn't want to leave the door to the outside open to get power out there for the setup. I ended up using an SD card logger on top of the Arduino that was keeping track of the travel time.
Finally, we needed a target to range. Luckily, this was easy to do with some wood sticks, hot glue, and a plexiglass base plate. I glued the target to the base 260mm from where the pinger was mounted. After a couple of quick tests, I had verified that the setup was working! Adding a temperature and humidity sensor to the breadboard gave us everything we needed. Time to collect some data!

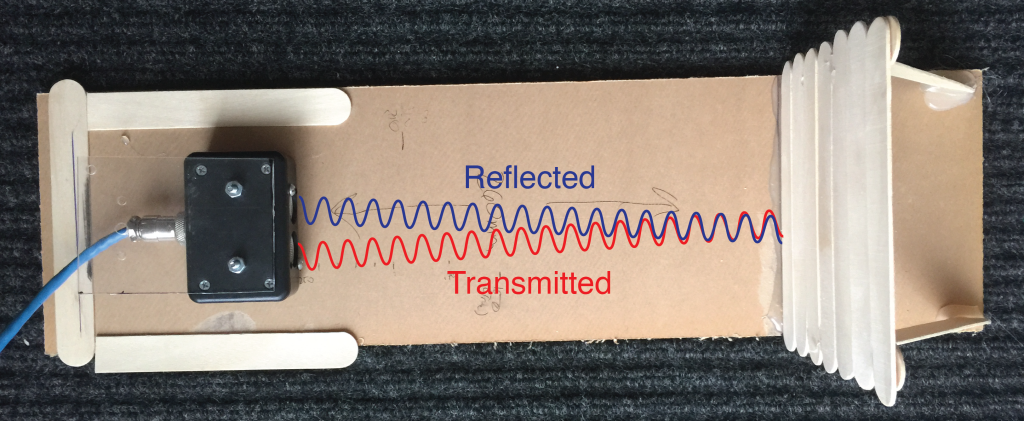
Schematic of sound packets being transmitted and reflected. Really these are spherical wave-fronts, but the illustration is much cleaner this way!
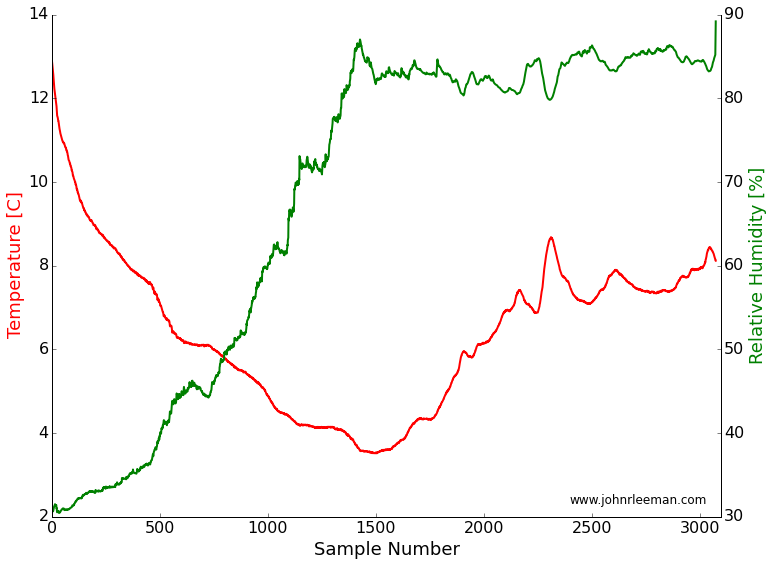
Luckily, we've had pretty wide temperature swings during the day here in Pennsylvania lately. Using a decent sized 12V battery and voltage converter I could get days of run time on a single charge. To get the best data possible, I averaged many travel times per sample. This took less than a minute to do, which is fine since temperature isn't changing that rapidly.
Now that a simple apparatus was complete, I placed it in a Rubbermaid tub to keep any stray precipitation (or the rodents) from damaging things. The data was stored in a text file containing two-way travel time to/from the target in microseconds, device estimated distance to target, and the temperature/humidity readings. I collected several days worth of data, each time slightly improving my recording setup to get the cleanest data. I had problems with days where the temperature varied very fast and it appears to have introduced noise, some days there was direct sunlight (a rare thing in the PA winters) that caused very high temperatures and convection in the tub. Finally, on the last day of my experiment, I got a nice data set. It was a day with slowly varying temperatures and mostly cloudy. I trimmed the ends of the data so things were equilibrated and got some decent results!
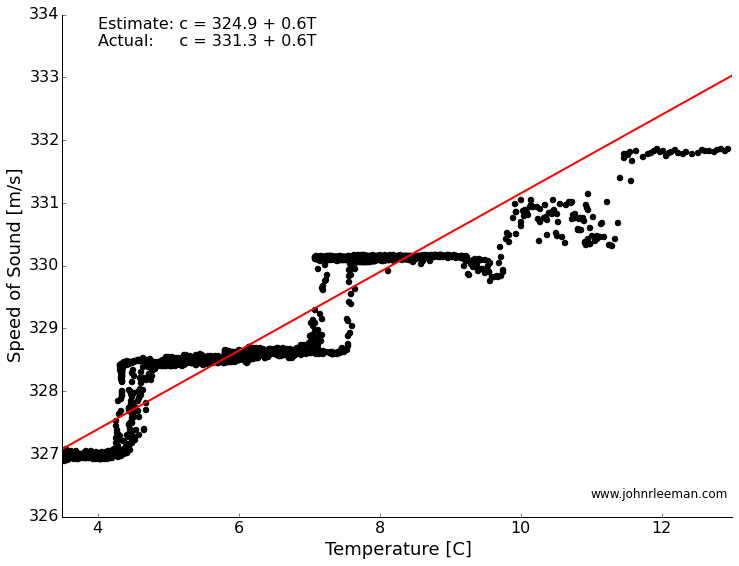
If we plot the temperature and the speed of sound against each other, we see what looks like a line! The steps are a result of being at the smallest increments in time that our system can sense. A better sensor could solve this, but for a rough estimate it turns out to be fine. Finding the best fit through this should tell us how well our measurements match the accepted formula. The slope of the line represents the rate of change of the speed with temperature (this should sound familiar to those calc. students out there), and the intercept represents the speed of sound at zero degrees.
We got the rate of change dead on! In fact we are within a few percent of the accepted value. The y-intercept is off by about 6 m/s, but I think that is a systematic offset due to a delay in the way the sensor is read. We could back that out, but maybe that is another topic for another time, or maybe we'll try this again with a different sensor. Please leave any comments or questions below!


