Tag Archives: geophysics

Quick Test of Geophone Response

I just wanted to post a quick article about geophones.  Geophones are essentially instruments that allow us to measure the velocity or acceleration of the ground.  Yes, seismometers do this, but generally when we refer to geophones we are talking about single sensor (almost always vertical sensing) devices used for seismic imaging in oil/gas exploration.  I've talked about seismic surveys before (here for example). The "element", or the actual sensor is pictured below.  These sensors have a magnetic element on a spring inside a coil of wire.  Motion of the magnet (resulting from ground motion) generates a small electrical potential in the coil.  If I can find a cheap element/case on eBay I'll do a teardown of one in the future.  The signal generation happens through a process called "electromagnetic induction", described by Michael Faraday in 1831!  Want to know more about induction? Head over to the wikipedia page or shout out and we can put together a demonstration.

Dr. Ammon, whose office is next door, brought over an old element that he wanted to compare with our seismometers in the basement of the building.  Not knowing the output voltage range well, we hooked it up to a Rigol DS1102E oscilloscope on my desk.  I set the trigger of the oscilloscope (when it started collecting data) to just above ground potential so that any appreciable motion will trigger data recording.  We recorded the voltage output of the sensor about 6800 times per second!

The sensor element from a geophone.  (Image: Ebay)

Below is the waveform collected from hitting my desk with moderate force.  Surprisingly these elements put out +/-4 Volts! When shaking the element to it's limits we were seeing voltages of around +/- 10 Volts.  To me this indicates there are many turns in the coil and a very strong, probably rare earth, magnet inside.  Measurement of the coil resistance or a teardown will tell if this is correct! I've also included the power spectral density for those of you interested.  These figures tell us about the frequency response of the instrument.  Depending on how the spring system is setup, the oscillator is very sensitive to some frequencies and not so sensitive to others.  These diagrams help us characterize this response.  

Collected waveform from hitting my desk.
Power Spectral Density

Power Spectral Density: Zoomed in

Sorry for the short post, but I just wanted to share a quick desktop experiment!

The Infrasound Bucket - Part 1 - Hardware

I'd like to write a short series of posts describing my setup of the infrasound unit I've written about before.  This is the same unit we used to look at traveling acoustic energy from the Russian meteorite and will soon use to examine earthquakes! Placing the unit inside my office or even inside the apartment proved to be very noisy as I saw every time someone opened or closed a door!  The makers (Infiltec) suggested that I put it outside, maybe in a drink cooler to shield it from the weather.  I did exactly that (photos below), but the cooler turned out to not be water proof and had about 2 cm water standing in the bottom when I checked it after a small storm.  The data quality while the instrument was outside was amazing though, with seismic signals coming through very clearly.  It was time to design a new system that would: 1) Be safe to leave outside in the weather, 2) Not have thick data cables running inside to a computer, 3) Would not require an inside computer, and 4) Would automatically post the current data online.

For the first post we're going to talk about the casing setup and mounting of all the vital hardware.  One weekend we decided to go wandering about Home Depot to find a suitable shell for the instrument as well as pickup a few other essential supplies.  Lendi had the flash of inspiration that we should use a 5-gallon plastic bucket... the ones at the Home Depot "Homer's All Purpose Bucket" even have an O-ring seal on the lid.  Perfect.

A built in O-ring seal on the bucket.

Now to figure out how to hold the hardware up off the bottom of the bucket.  In an ideal world this isn't needed, but in reality water may get in and I don't want it covering electronics thrown in the bottom of the bucket.  We used 1/4" plywood cut to a keystone shape that just fits the vertical profile of the bucket.  Adding two "L" brackets from the shelving section meant for ~$15 we had the shell and left over plywood.
Test fitting the plywood into the bucket.  Notice the cooler in the background that formerly housed the instrument.

I bolted the infrasound unit to the wood by using "plumber's tape" or metal strap with holes down its length.  This isn't the most elegant solution, but it meant no drilling the infrasound case which is semi-sealed on its own.  It is also very easy to get the unit out for any maintenance.   My RaspberryPi ended up having problems on the circuit board, so I've bolted a Beagle Bone Black to the board as well.

Front of the mounting board.  Infrasound unit (right), Beagle Bone (left), and power plugs (top left).

Rear of the mounting board with power passthrough.  

With no tall standoffs handy I made use of locking nuts, washers, and other assorted 4-40 hardware.

Two holes were drilled in the side of the bucket: one for the power and one for the air tube to the infrasound instrument.  I passed the power cable through (outdoor zip cord) through as well as clear plastic tubing and sealed it with bathroom silicon sealant.  I'd recommend sealing on the inside and outside of the bucket bulkhead.  Make sure to leave extra cable and tube for drip loops. A drip loop like structure was fashioned on the outside of the bucket to ensure no rain would blow up the tube into the unit.  We taped the tube down and then ran beads of silicon to secure it to the bucket.  After the sealant dried we moved the tape and secured the rest of the tubing.

Power and air tube sealed into the bucket and loops to prevent water flow.

Inside the bucket: notice the power plug.

In later posts we'll talk about how the power is actually provided and such, but the part that pertains to the hardware is the mounting of two binding posts on the plywood at the standard 3/4" spacing.  This allows us to power the board from a banana jack on the bench for testing or operationally in the bucket.  I drilled a passthrough hole to send power from the back of the jacks to the front of the panel.

Initially I built a 5V regulator to power the computer with from an LM7805 linear voltage regulator, but this was indeed a poor choice.  Even with a decent heat sink, the chip still got blistering hot when I was drawing 700mA (of the 1000mA rated power).  Considering this would be outside in the summer heat and the fact that I didn't want the failure point of a mechanical fan I decided to use a buck voltage converter.  Linear regulators dissipate all extra power as heat.  For example: I was feeding 12VDC to the converter with a 700mA load running at 5VDC.  That means that (12V-5V)*0.7 = 4.9 Watts of power was being turned into waste heat! No wonder, remember we think of watts as energy/time (Joules/second actually).  That's a lot of wasted electricity and really just a complication to our design, but it was very clean power.

The old linear regulator.  It's now awaiting a new use in the parts bin.

The buck converter is a switching type regulator.  I don't want to get into how switching regulators work current, but it's an interesting topic and you should have a read on the theory if you like.  I bought a small unit (P/N 1385) from Adafruit that is rated to 3A (though it gets warm there).  The power isn't quite as clean from this switching supply, but it's fine for out use here.  It works great with the Beagle Bone and provides lots of extra power for 5V accessories.  Don't want to order and ship from Adafruit? You can get the exact same thing from a model shop.  They are called "battery eliminator circuits" and allow modelers to plug their airplane, car, etc servo electronics (5VDC operation) into a 12V battery they already have in their kit.  Just clip the 3 pin servo plug off the end and you are ready to go.  Don't forget good soldering practice and to use heatshrink tube! Shorts could spark a fire, which we don't want.

The "battery eliminator circuit" or my 5V buck converter to supply 5VDC to the Beagle Bone.

So there it is! Next time I'm going to talk about setting up the power and network infrastructure.  Maybe even the serial communications! We're going to try to avoid using a serial-USB converter since the Bagle Bone has only one USB port (that I'm using for a WiFi adapter), I don't want to use a hub, and it's a chance to learn about signal level shifting and wire into that temping header on the board.

Everything fit into the bucket nicely and powers up from the bench power supply.

Texas Fertilizer Plant Explosion Shakes the Ground

Another quick post of some interesting data concerning the explosion at the fertilizer plant in Texas.  Yesterday (4/17/13) there was a large explosion at approximately 7:50 pm local time.  As of early this morning reports showed around 179 people hospitalized, 24 in critical condition, and 5-15 fatalities.  Currently 3-5 firefighters and one law enforcement officer are unaccounted for.  Over 60 homes were damaged by the very large blast.

The best video I've seen so far is attached below, the explosion happens around 30 seconds in.  Also below is the initial emergency services traffic.


Finally, we can look at data from the Amarillo seismic station (US.AMTX).  I've pulled down the data and filtered it to show all frequencies above 1Hz.  We expect the explosion to produce mostly high frequency signals and attenuate, or lose strength, quickly (why I didn't see the explosion on any other stations such as US.WMOK in Oklahoma).  It looks like there are 6 main pulses of energy (possibly tanks failing?) very quickly and the large explosion in a period of around 10 seconds.

If you want to look at the data yourself I've made the SAC file available here or you can download the data from IRIS and duplicate the filtering with the following OBSPy code:

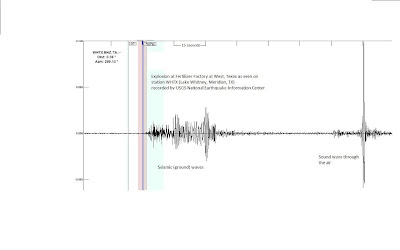
EDIT: The USGS posted a transportable array station that was closer to the event (seismogram below) that shows both the fast ground waves and the slower air blast.  They classify this as a magnitude 2.1 event on the event page, but it's really a larger explosion than that hints at as magnitude is only based upon ground motion.

April 2013 Oklahoma Earthquakes

This morning Oklahoma experienced another small sequence of earthquakes.  (There was also a large earthquake with an estimated magnitude of 7.8 in Iran over night.)  While I'm preparing for a conference very soon I'm a bit crunched for time, but thought a short post would be in order.  I would like to write a few posts concerning what magnitude is, how we calculate it, and other common questions I get asked at some point in the near future.

Okay, here's the synopsis of the most recent events. Early this morning at 01:56:29.875 CDT a magnitude 4.7 earthquake occurred centered northeast of the Oklahoma City metro area.  There have been a few significant aftershocks at magnitude 3.0, 3.6, and 4.6.  It is notable that there was a higher number of seismic events (though all small) beginning yesterday.  All these numbers are from the Oklahoma Geological Survey, the USGS estimates are lower with the largest events at 4.3, 4.2, and 3.3.  These magnitudes are computed on slightly different scales, but either way the largest earthquake released over 10 times LESS energy than the earthquakes last year.

The USGS did you feel it program has already collected around 1600 responses and the shaking reported matches very well with what was expected, probably due to the DYFI scale being pretty accurately calibrated after the large earthquake sequence last year.  It was striking that the vast majority of the responses came within 90 minutes of the quakes indicating the people actually got up and reported as soon as the event was over.  These responses really help the folks at the national earthquake information center (NEIC) and if you felt the earthquake but didn't go fill one out you should!

The moment tensor solution of the earthquake shows a strike slip solution meaning that the rock moved laterally past each other, not up and down.  This is shown by the "beachball" below with the colored regions indicating areas of compression.  There isn't enough information from one earthquake alone to tell if the fault runs SW to NE or SE to NW, but based upon the distribution of the large aftershocks it would be an okay initial guess that the fault trends to the NW.  Also notice the solution isn't perfectly strike-slip.  There is a small amount of oblique motion with a thrusting sense.  
After inspecting the infrasound instrument I have in my office I didn't see the earthquake, but the ground motion wasn't really detectable on the seismic station in Standing Stone, PA either.  It looks like the infrasound may have recorded the Iran earthquake, but I need to move it to a less noisy location.
Just for fun I've thrown in a seismograph below from a station in the Wichita Mountains in SW Oklahoma.  It would be fun to calculate the different arrivals and plot, but that's more fun for another time! I've made the trimmed .SAC file is available here in case you want to download it and try.

Seismic Evidence From the Russian Meteorite Explosion

Today we're going to follow up on the last blog post about the explosion of a meteorite over Chelyabinsk, Russia.  The process of figuring out precise infrasound arrival times is quite a tricky process, the travel times depend on winds, humidity, and many other atmospheric variables that are hard to constrain over such a long travel path.  I've had several fantastic discussions with Dr. Charles Ammon here at Penn State to try to obtain the infrasound data that was collected near the blast, but so far we have not been able to get it.  When/if we do, expect another posting.

The focus of this post will actually be the seismic data near the blast.  There are many seismometers all over the Earth that record the motion of the ground many times a second.  After some discussion of the infrasound and seismic data available with Dr. Ammon, we found some really nice, simple results that would make a great laboratory assignment for an introductory seismology or geoscience class.  The activity could range from reading times of arrivals on provided graphs for a non-majors class, to filtering and grid searching to estimate the precise detonation location for a more advanced class.  I've provided the data and some thoughts on it below.

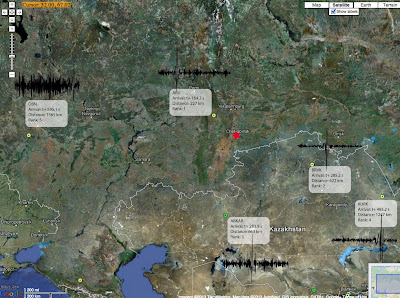
We'll consider data from five seismic observatories, the station names are ARU, BRVK, KURK, OBN, and ABKAR.  Below is a map showing the station location, distance to the blast (red star), and a seismogram from that station.  The seismogram shows how the ground is moving through time, in this case I'm showing the "Z" component.   This really just means we're looking at how the ground is moving up and down, though these stations also record North/South and East/West movement.  What we see is ground motion caused by the shock wave hitting the ground and that ground motion propagating away.

Fig. 1 - Map view of the seismic stations used.  Distance from the explosion, time after the explosion to a phase arrival, and arrival order (rank) are shown along with the seismogram.  All seismograms begin at the instant of the explosion.

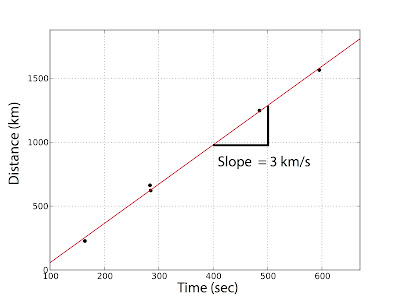
It's common sense to expect the energy from the explosion to arrive at a later time at stations further away, which it does.  Notice how the sharp peak corresponds to distance? We can actually make a plot of this and learn some more from the data.  To do this, pick a feature that is easily identified in each waveform (we used the first trough) and record how many seconds after the blast it arrives at the instrument.  We then plot that on the x-axis of a graph and the distance of the station from the blast on the y-axis.  The result should be something like that shown in figure 2.  Now we can use some basic math to figure out how fast this energy was traveling.  The red line on the figure is the "best fit line" to the data.  We use some basic statistics (a linear regression) to make this line, but any plotting program will do it for you.  A line has a slope (how steep it is) and a y-intercept (where it touches the y-axis when x is zero).  The slope of a line is how much the y values change per a certain change on the x axis, often taught as "rise over run" in the classroom.  The slope of this line turns out to be about 3km/s.  That's a pretty reasonable speed for surface waves (which these are) through the ground!

Fig. 2 - The distance from the blast against arrival times.  This data indicates the surface waves traveled about 3km/s, a reasonable speed.

If we could pick out a "p-wave" in the data (difficult for reasons we will discuss), the intercept of the line would be the height above the ground that the blast happened.  I haven't seen a really good estimate of the height, probably because the p-wave is hard to find and the speed of the meteorite. The meteorite was traveling about 40,000 mph when it exploded.  It's hard to imagine something moving that fast, so let's change around the units: that's something like 11 miles every second!

The p-wave could be hard to see because 1) it's going to be relatively small, and 2) there are waves from an earthquake in Tonga arriving about the same time as the meteorite explosion.  We know the waves we picked aren't from the tonga event, those would have arrived at all the stations at almost the same time because they were reflecting off the Earth's core.  It would be an interesting project to play with trying to pick p-waves and/or estimate their arrival window by guessing the height of detonation.

We don't have to stop here though.  This morning I saw this youtube video, a compilation of people recording the shockwave.  The meteorite had streaked past, exploded, and they were recording this when the shock wave hit.  Shockwaves behave in a funny way, but luckily it's been studied a lot by the government.  Why? Nuclear weapons! Seismologists are commonly employed to determine if a nuclear test has taken place, and estimate it's size, location, etc.  A lot of very interesting information on air-blast and it's interaction with buildings can be found in the book "The Effects of Nuclear Weapons".  The book has lots of formulas and relations that could make many interesting lab exercises, but we'll just discuss reflection in this post.

A shock wave is really a front of very high air pressure that is propagating through some material.  The high pressure is followed (in a developed shock wave) by a small, longer, suction, then a small overpressure.    I've tried to locate meteorological observations and so far have only found hourly observations.  If we can find short term observations we would expect to see wind rushing away from the blast, then more weakly towards it, then very weakly away from the blast.  By knowing those wind velocities we could estimate the pressure differential that caused the shock.  The local airport (station USCC) does report hourly average winds (data here).  There is a small bump in the average winds between 9-10am local time, when the meteorite entered.  The lack of a gust report though makes this observation a bit too shaky to use for a pressure estimate.  

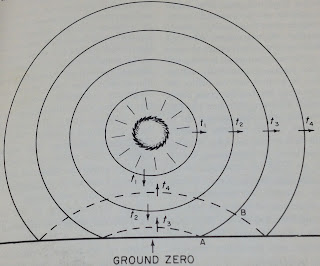
Shock waves move faster than the speed of sound if they are a high enough "overpressure", or the pressure above atmospheric.  Shock waves will reflect off the ground when they reach it, as shown in figure 3.  The overpressure in the region of "regular reflection" is much higher than the overpressure of the shock wave due to a combined stacking effect.  There can also be complicating patterns such as "Mach Reflections".  

Fig.3 - The initial pressure wave (solid lines) and the reflected shock (dashed lines).  Image from "The Effects of Nuclear Weapons"

What's interesting about all this is the audio of the clips at about 20 and 40 seconds into the YouTube video.  Notice these clips contain two bangs.  The first clip with two shocks could be reflection off the building behind the camera, the second shock follows the first very close and is very loud.  The next clip has a significant delay though.  At any height above the surface the initial reflection occurred on, there will be a delay between the initial and reflected shock.  If we knew the location of this video it would help constrain the shock location.  (After some google searching I can't locate the "Assorty" store in the footage anywhere.)

Overall with the observations of glass breaking over such a large area, we can assume the reflected pressure was probably in the area of 1psi.  This means the initial overpressure was very small at the ground.  Could you work backwards from the estimate of 500 kiltons TNT? Sure! That's a topic for another day or for your students in lab! Be sure to check out the book "The Effects of Nuclear Weapons", many campus libraries have it, Penn State has it online even.

Below is a link to a zip file that contains the .SAC files for the seismic stations (starting at detonation time and low pass filtered as well as raw data) and high quality figures.  If I end up writing up a lab from the event, expect the data and lab to be on my academic website.  A review of literature on the Tunguska event may be helpful as well!

Zip file of data.

Chelyabinsk Meteorite - Infrasound, Seismic, and Satellites oh my!

Just as Earth was about to have a close encounter with asteroid 2012 DA14, the people of Chelyabinsk, Russia had a personal experience.  Before we talk about both 2012 DA14 and the Chelyabinsk event some terminology needs to be set out.  A meteoroid is a small chunk of debris in space, generally anything from a fleck of dust to a small boulder.  A larger space bit of debris is termed an asteroid.  A meteor is when some of this debris enters our atmosphere, heating up due to friction.  A meteor is called a meteorite if it actually reaches the surface of the Earth and survives impact.  Everyday we are pelted with many tiny meteors, but few reach the surface.  Most meteorites are never discovered as they are statistically much more likely to land in the ocean due to it's coverage of Earth's surface.  Sometimes meteorites are found on land, in fact it is common for scientists to go to Antarctica to look for the dark rocks on the surface of a white sheet of ice.  There are many pages on hunting meteorites  and a book as well, it's worth reading about if your curious how we find rocks that landed a long time ago.

It's worth saying that there are different kinds of space debris, some more stony, some made of almost solid metal, and some of ice.  While it's worth discussing, I'd rather focus on the current events in this post, so if you are curious there is a nice page at geology.com that gives the basics.

To begin, lets talk about 2012 DA14, or the non-intuitive name that we gave a near Earth asteroid that is about 160 feet in diameter and weighs a massive 190,000 metric tons.  This asteroid could do some serious damage and was scheduled to have a close call with Earth on February 15th.  How close? Well, it would be about 17,200 miles from the surface, which seems like a long way.  It's not.  The moon is 250,000 miles away (roughly) and we've been there and back in a matter of a few days.  In fact, the geosynchronous satellites that beam TV and weather data down to Earth orbit about 22,236 miles above the surface to rotate at the same rate the Earth does.  As shown in the figure below, 2012 DA14 passed between us and the geostationary satellite band; a very close call.

Why talk about 2012 DA14 in a post about a meteor over Russia? To say they are not related in any way.  They approached from entirely different directions and it just happened to be a coincidence of space and time.

Now for the event in Russia.  At 3:20:26 UTC on Feburary 15th a large meteor about the size of a schoolbus entered the atmosphere.  The 49-55 foot estimated diameter object probably weighed about 7000-10000 tons.  While heating up upon atmospheric entry the meteor "detonated" or exploded in mid-air.  This has happened before, a list of historic airbursts can be found here.  The most famous being a large explosion (also over Russia) in 1908 called the Tunguska event.  That explosion released the energy of 10-15 million tons of TNT, leveling forests and destroying an area of about 830 square miles.  The event that just occurred was about 500 kilotons of TNT equivalent, or roughly 20 times smaller.  Shock waves from the event still managed to send around 1500 people to local hospitals with shards of glass and building materials in their faces/skin from rushing to a window too see what was happening.  Videos of the entry are all over the web, in several you can hear the detonation and shock wave.

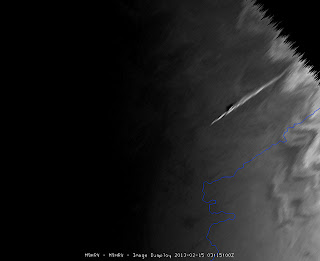
So how do we know so much about this object considering we didn't know anything about it until it exploded overhead? Well, remote sensing helps us.  When a meteor entered over Wisconsin in 2010, I wrote about following the trail on the US Doppler Radar Network (here).  This time we could see the meteor from weather satellites (Meteosat 10 image below) as well as on seismic and infrasound stations.  Another meteosat also captured several frames that have been made into a video here.  Current estimates of the entry speed are in the area of 40,000 mph with a very shallow entry angle.

First the seismic observations.  So far I've seen reports of the Borovoye, Kazakhstan station seeing a gorgeous signal (thanks to Luke Zoet on this one). The station details, and even a photo are available at the USGS network operations page.  Below is a filtered (0.15 Hz low-pass) seismogram from BRVK.  This would be a result of the shock wave rattling the ground and seismic station.

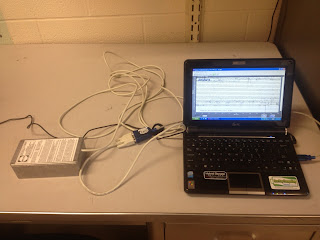
Next, and rather interesting, are the infrasound observations.  Infrasound is very low frequency sound (below 20Hz) that we can't hear, but can record as air pressure variations.  It so happens that Steve Piltz of the Tulsa National Weather Service has a microbarograph.  Upon seeing his data from an earlier earthquake (yes, ground movement causes air pressure waves), I immediately bought a unit from Infiltec and set it up in the office at Penn State.  Below is a picture of the station.
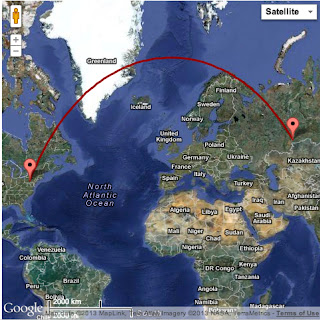
Infrasound propagation is incredibly complex and difficult to predict over such long distances, so I've done a simple calculation that is very likely going to be revised upon some discussions with seismologists this week.  First, I wanted to know how long the sound would have to travel.  To find the shortest travel distance between a latitude and longitude set you can assume a spherical Earth (not too bad for such a back of the envelope calculation) and some math.  Remember trigonometry? Well when it's modified to work on a sphere instead of in a plane it's creatively called 'spherical trigonometry' and consists of a strange function called the haversin.  If you are curious about how I calculated the travel path of the sound waves checkout the wikipedia page on the Haversine formula, but I've included the formula below.  Below is the result of the calculation, a great circle path between Chelyabinsk and State College, PA.
d = 2 r \arcsin\left(\sqrt{\operatorname{haversin}(\phi_2 - \phi_1) + \cos(\phi_1) \cos(\phi_2)\operatorname{haversin}(\lambda_2-\lambda_1)}\right)

The distance the wave would travel would be something like 8670 kilometers.  Sound travels at 340.29 m/s at sea level, but since we're making assumptions we'll say 300 m/s is a nice number.  So the wave would take somewhere in the 7-8 hour range to reach State College (assuming it's non-dispersive and many other likely not so great assumptions).  Luckily for us, the event and the arrivals are overnight.  During the day my infrasound station is swamped by signals from office doors opening and closing amongst other things.  The meteor entered the atmosphere at 10:20 pm local time, so I've plotted the infrasound from 10 minutes before the meteor entered to well after the energy should arrive.  There is a large increase in the noise shortly after entry, but this is too soon.  Could it be seismic energy or arrival of a faster shock path? Maybe, that's a point for some discussion and revision later.  The big thing to notice is the noise increase at about 7-8 hours after the entry.  It's still early in the morning, so it is doubtful that this is people coming into work.
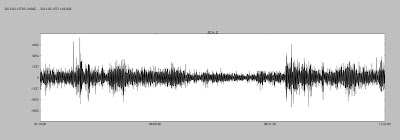
I've made a .SAC (seismic analysis code) file of the raw data for about 24 hours around the event available to download here.  Download the file (~19Mb) and play with it! The data is collected at 50Hz, but all that is in the meta-data (as well as location details).  I use ObsPy to do most of my analysis in Python, but you could use SAC or other codes meant for seismic event analysis.

Steve's station in Oklahoma recorded similar signatures.  His data over a slightly shorter time span (5:21-11:42 UTC) is below, showing similar signatures.

Infrasound is actually what allows us to determine the energy release from the explosion.  As it turns out seismic stations and infrasound have been used to monitor nuclear testing for years (a relevant topic currently considering the recent tests by North Korea).

Overall, I'd say stay tuned for any updates.  Eventually the infrasound station I have will be setup for live streaming.  I'm sure after discussion with some folks more versed in infrasound travel we can clean up the data and maybe do some more back of the envelope energy/rate calculations for demonstation purposes.