Tag Archives: earthquake

Tracking Earthquakes Across the Globe - Travel Times

A few days ago I had the Epicentral+ app running on my iPad sitting on my desk and saw an event come on the screen. By looking at what stations were measuring ground movement first, second, third, etc. I could make a good guess at the event's location. Did you know that, with the data from a single seismic station, you can begin to guess the epicenter?

Generally earthquake locations are performed using many stations and algorithms that have been tweaked for years as we want to get ever more accurate locations. The USGS does this location for many events every day. It's fun to keep a live feed of the global seismic data up and look at the patterns. This is possible thanks to applications like "Earth Motion Monitor" and "Epicentral+", both products of Prof. Charles Ammon. They are worth installing and having a look. Prof. Ammon has seen the value in being able to watch signals for long periods of time: you begin to pick out patterns and get an intuitive feel for the response seen due to different events. While I don't have nearly the amount of insight possessed by experienced seismologists, I wanted to show you a quick and simple way to figure out about how far an event was from a given station. If you combine that with some geologic knowledge of where plate boundaries are, you can likely narrow down the region and earthquake type before anything comes out online.

The event I saw is a pretty small event, a magnitude 5.8 near the Fiji islands; it'll work for our purposes and not provide too much distraction. I've marked it with a white star on the map below (a Google Earth map with the USGS plate boundary file). This event occurred near the North New Hebrides trench, part of a slightly complex zone where the Australian plate is being pushed under, or subducted, beneath the Pacific plate.

Our earthquake in question marked with a white star near the North New Hebrides trench.

Our earthquake in question marked with a white star near the North New Hebrides trench.

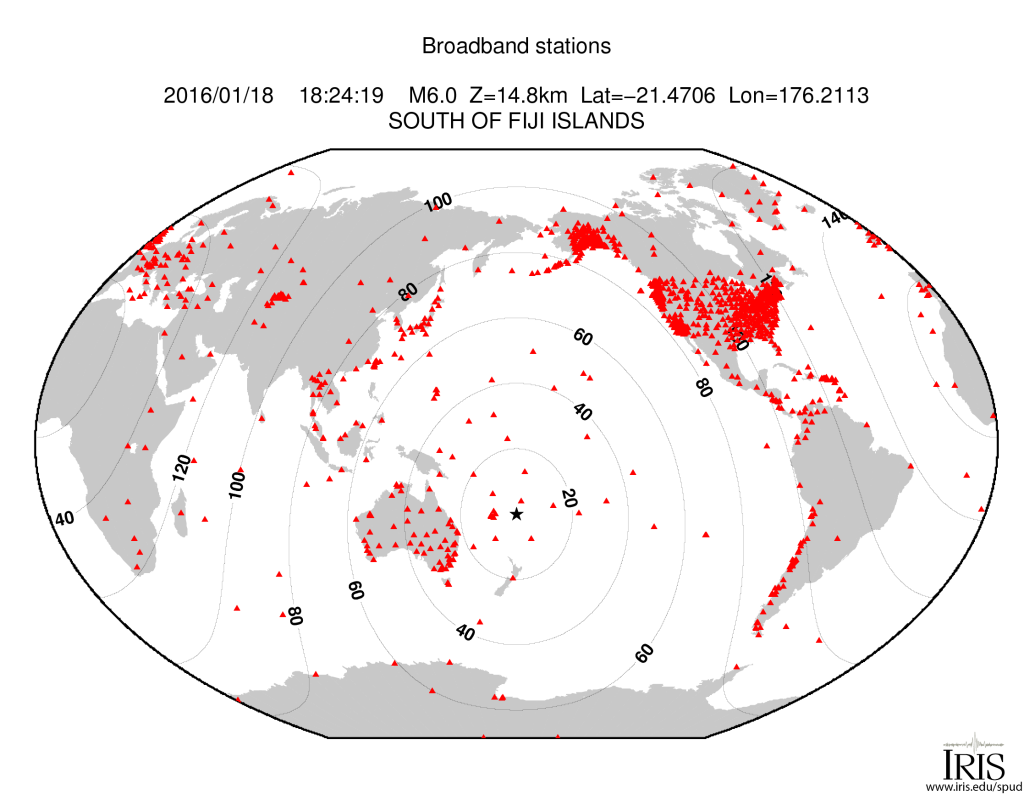
Though the event was not huge, it was detected by many seismometers around the globe. In fact, there is a handy map of the stations with adequate signal automatically generated by IRIS. The contour lines on the map show distance from the event in degrees (more on that later).

Stations and their distance from the earthquake. (Image: IRIS)

Stations and their distance from the earthquake. (Image: IRIS)

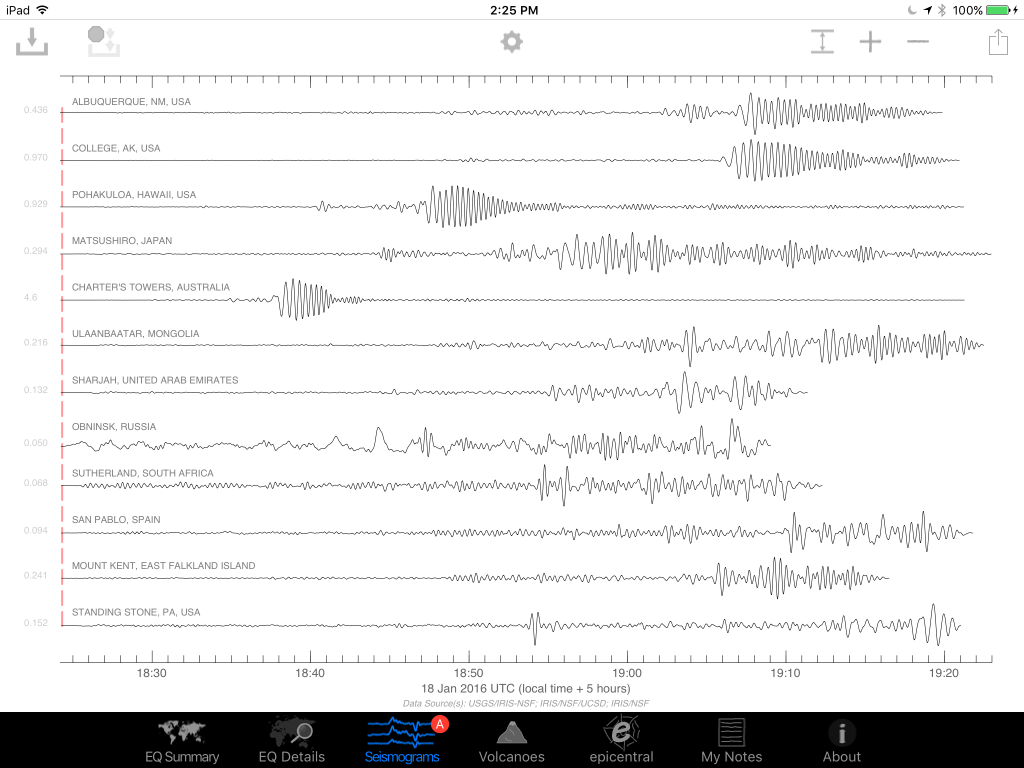
I saved an image of assorted global seismic stations about an hour after the event occurred. You can see energy from the earthquake recorded on all stations, with some really nice large packets of surface waves (the largest waves on the plot).

raw_seismograms

We're actually interested in the first two signals though, the classic P and S waves. Let's take a closer look at the station in Pohakuloa, Hawaii. We can see the first arrival, the P-wave, then a few minutes later the S-wave. The P-wave (a compressional, basically a sound-wave) travels faster than the transverse S-wave, so they arrive at different times. We know the wave speeds with depth in the Earth, so by using the difference in time between these arrivals, we can come up with a rough distance to the event.

seismograms_annotated

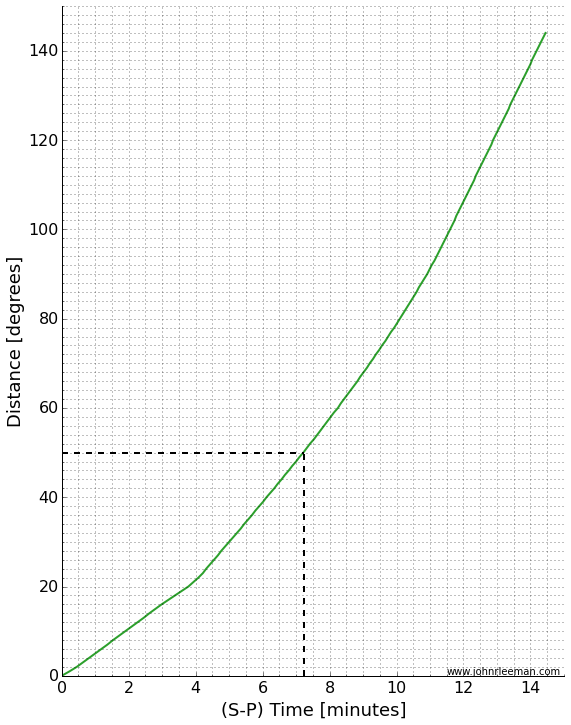
A graph of distance vs. arrival times can tell us the whole story. I've made a simple version in which you can find the time we measured (7.25 minutes) on the x-axis, then lookup the distance on the y-axis. If we do this (marked in dashed black lines), we see that the distance should be about 50 degrees.

SmP_time_curve

That's not bad! I calculated the actual distance knowing the earthquake location and station location to be 49.6 degrees. The theoretical difference in travel time based on a simple Earth model is 7.14 minutes. The slight error is due to a complex real Earth, but mostly due to me picking a rough time on an iPad screen without really zooming in on the plot. The goal was to know about how far away the earthquake was from the station though, and we did that with no problem. Just from that information it was easy to tell that the event was in the Fiji region.

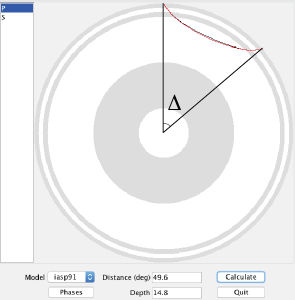
Distance is in degrees, which may seem a little strange. Since the Earth is a ball-like blob, defining distances across the surface is a little tricky when distances get large. It turns out to be more convenient to think of this distance as an angle made with the center of the earth. Take a look at the screenshot below. It's from a program called taup and shows the actual paths taken by the P and S waves through a cut-away of the Earth. I've marked the angle I'm talking about with the greek letter ∆. (We would formally say that this is the great circle arc distance in degrees. If you want to learn more about great circle arcs, you should checkout our two part podcast on map projections.)

taup_path_annotated

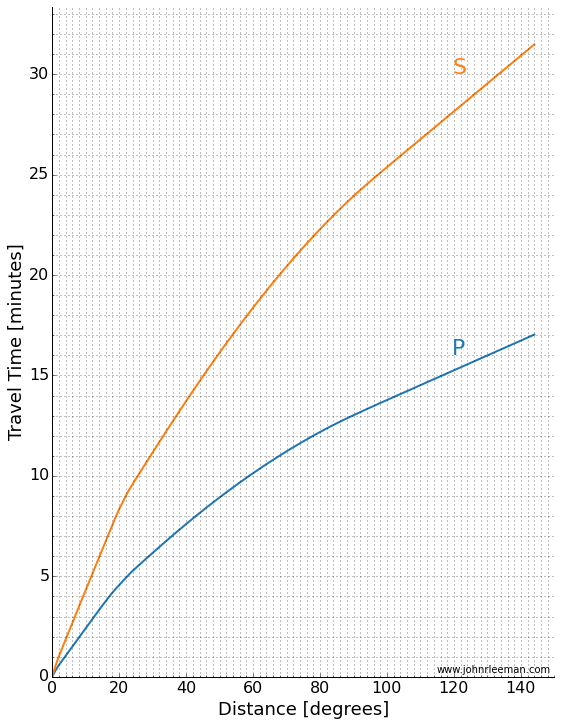
As scientists, we often look at a travel time plot a little differently. There are many different waves or "phases" that we are interested in, so plotting one line of  S-P wave arrival is rather limiting. Instead we plot a classic "travel time curve" where the arrival time after the event is plotted as a function of distance. I've reproduced one below (table of data plotted from C. Ammon).

travel_time_curve

We can make a plot like this from data too! Taking many stations, plotting them as a function of distance we get a plot like the one below. You can see curved and straight lines if you stand back and squint a little. Those are arrivals of different phases across the globe! Notice the lower curved line that matches the P-wave travel time above.
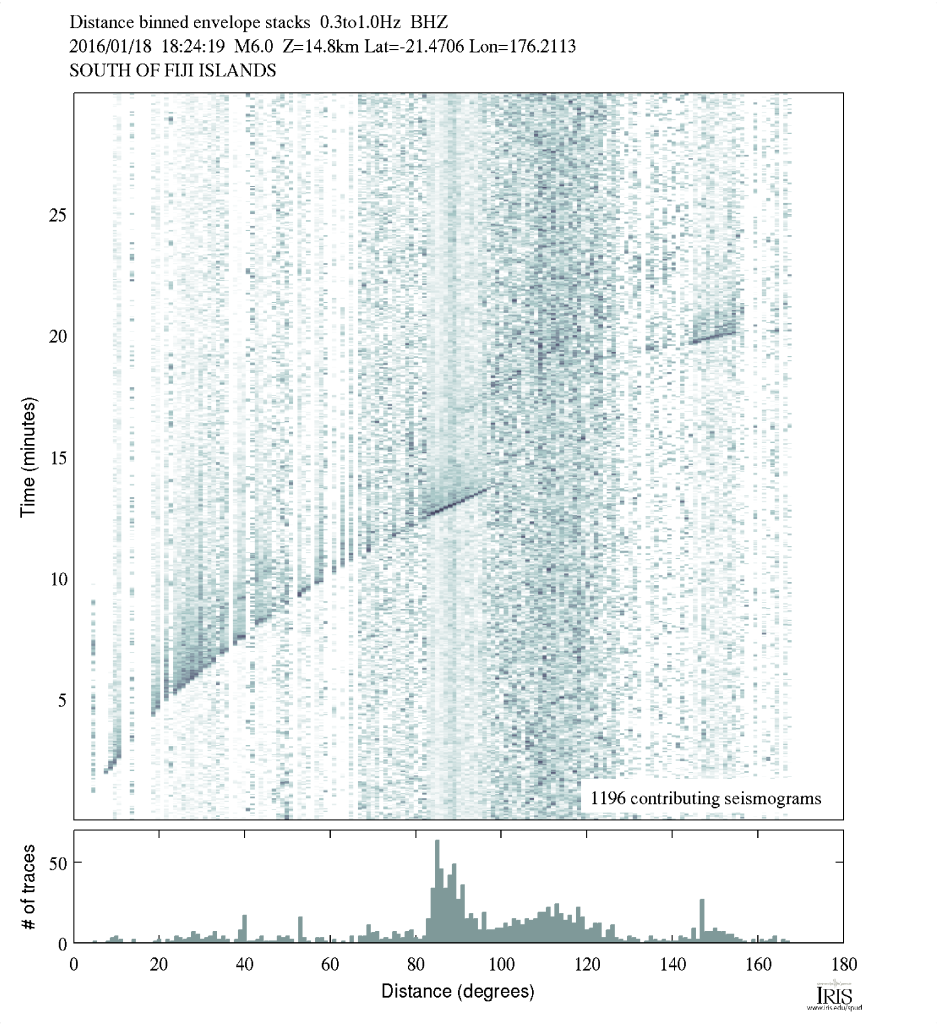
Notice the lines and curves made as different phases from the earthquake arrive across the globe. (Image: IRIS)

Notice the lines and curves made as different phases from the earthquake arrive across the globe. (Image: IRIS)

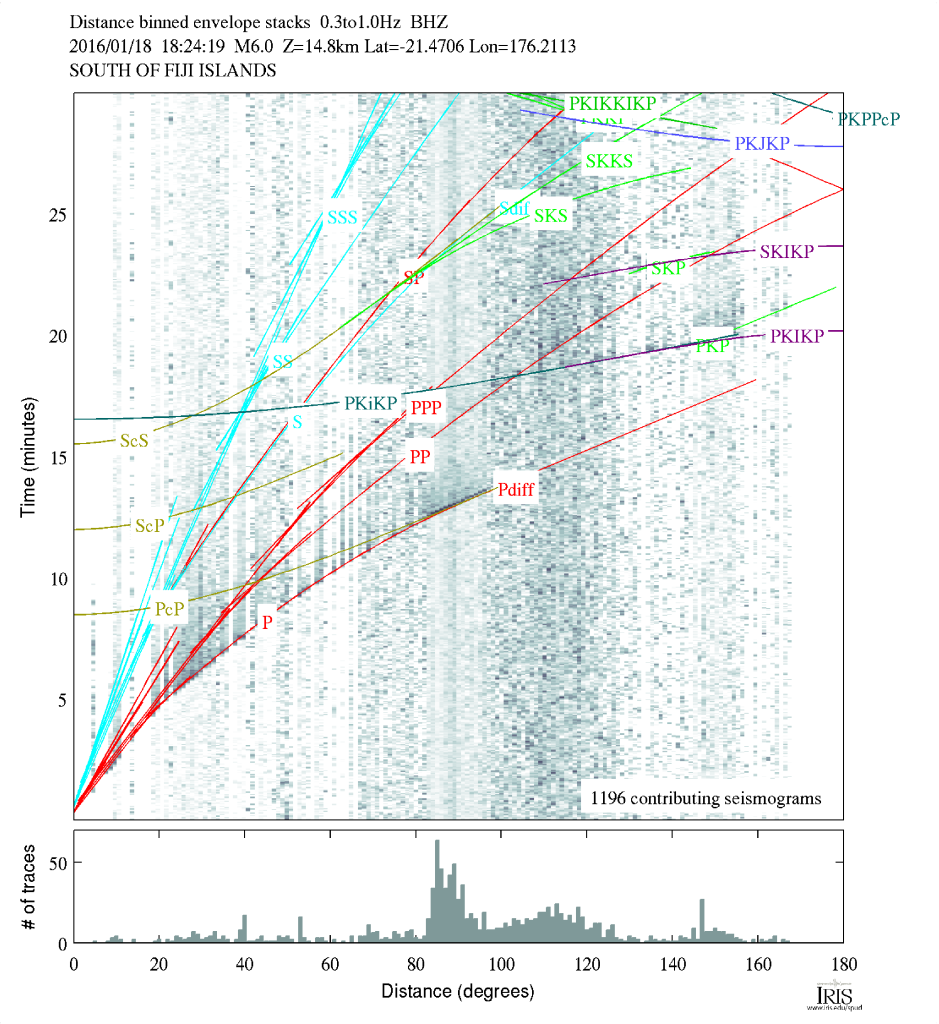
Like I mentioned, there are many different phases we can look at. To give you an idea of things a seismologist would look for, there is a version of the plot with a lot of the more complex phases marked on it below. I know it looks intimidating, but for this event, you'll see we really can't easily discern a lot of the phases. That's because this really isn't a huge event, but it's nice for us because that means the plot is easier to look at.

Arrival plot with phases marked. (Image: IRIS)

Arrival plot with phases marked. (Image: IRIS)

So there you have it, by remembering the rough travel time curves or posting one on your wall, you can quickly determine the approximate region an earthquake occurred in just by glancing at the seismograms!

Are Rocks like Springs? A Video Demonstration

Today I was getting a demo in the lab ready for a tour group and decided to try shooting a quick, unscripted bit on rocks as springs.  There are a few generalized statements in here, but overall it is a first try at a public education video.  Comments welcome!

It's All About the Waves - 2014's First Magnitude 7+ Event in Chile

There's been a decent amount of chatter amongst Earth scientists that it has been a long time since the last magnitude 7 or greater earthquake.  In fact, there hadn't even been one in 2014 until last night.  The earthquake is currently rated an 8.2 (mww) and occurred in a well known seismic gap that has been published on a decent amount in recent years.  The last major earthquake in North Chile was an 8.6 in 1877! Many smaller earthquakes in the area over the last weeks have kept everyone on their toes.

This location in Chile marks a major plate boundary where the Nazca plate is subducting, or being pushed under the South American plate.  The idea of subduction is that the two plates are being forced together and one ends up getting pushed underneath the other.  In this case, the cold and dense oceanic crust gets pushed underneath the less dense continental crust.  As we would expect, this means that the earthquakes occur on a very shallow angle thrust.  Moment tensor solutions can tell us about the fault by analyzing many seismograms.  Turns out that the moment tensor solution looks like about a 12-18 degree dip on the fault, not out of line with our prediction.  There are a lot more of the advanced scientific products such as the moment rate function here.  It looks like the rupture lasted for around 100 seconds and slipped a maximum of 6.5 meters (21 ft.) at a depth of near 30 km (18.6 miles).  The earthquake started a little more shallow though, about 20 km (12 miles) down.

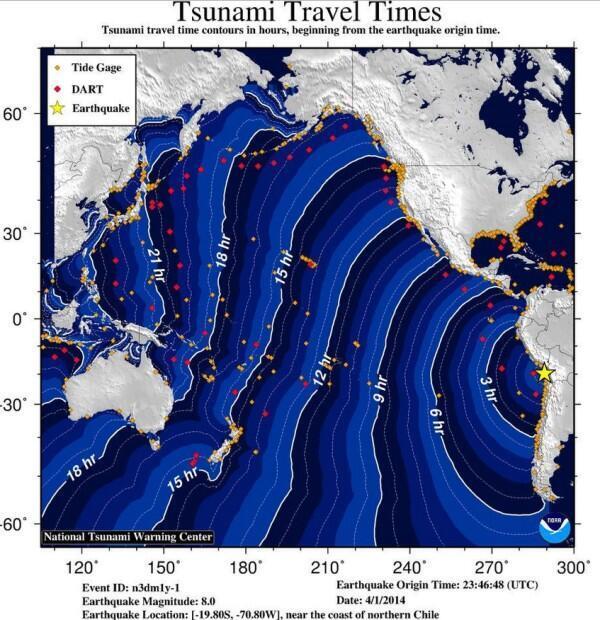
There have been many aftershocks with the event, some sizable.  At the bottom of the post I've provided a channel list that I'm using to watch the aftershock sequence on the EpiCentral app (for iPad).  What I want to show are the buoy data though!  When a large earthquake of this type occurs, waves are generated in the ocean and the folks at the Pacific Tsunami Warning Center go into action.  There were some significant waves near Chile (about 2m/6.5 ft.).  It looks like, for the time being, most other locations such as Hawaii may be in the clear.  As I'm writing this the remnants of the waves should reach Hawaii in the next few hours.  Below is a rough travel time map from NOAA.

ChileTsunamiTravelTime

A list of the observations from the  warning center can be found in their most recent statement.  We can actually access the buoy data and look at the wave propagating across the ocean though!

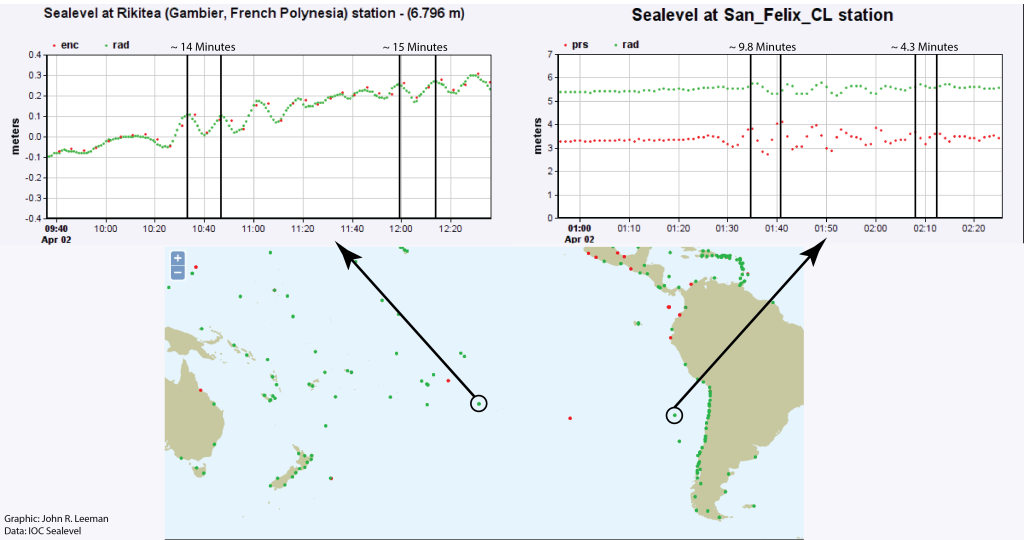
When waves propagate across the water (or many other media) they often experience a phenomena called dispersion.  The idea is that waves are actually made of many frequency components, or notes if you will.  Because of some physics funny business, the longer period (lower frequency) waves will actually travel faster than the short period (high frequency) waves.  We can see this in the data below.  I'm showing two stations for sealevel.  They have different types of sensors, but that's not too important.  Be sure to click on the plot to see it full size (the link will open in a new window/tab)!

Wave_dispersion

We see exactly what theory predicts, long period waves coming in first, followed by progressively shorter period waves.  We also see that stations further out don't see the high frequency waves.  This is another phenomena in which the medium filters out high frequency waves over the travel.  We would say that the high frequency waves have been strongly attenuated.

That's all for now! Thank you for sticking with me through some interesting observations of predictions from math and physics!

Channel List:
C;GO01; --;BHZ;VERTICAL,CHUSMIZA, CHILE
C;GO01; --;BHE;EAST-WEST, CHUSMIZA, CHILE
C;GO01; --;BHN;NORTH-SOUTH, CHUSMIZA, CHILE
IU;LVC; 00;BHZ;VERTICAL, LIMON VERDE, CHILE
IU;LVC; 00;BHE;EAST-WEST, LIMON VERDE, CHILE
IU;LVC; 00;BHN;NORTH-SOUTH, LIMON VERDE, CHILE
C;GO02; --;BHZ;VERTICAL,MINA GUANACO, CHILE
C;GO02; --;BHE;EAST-WEST, MINA GUANACO, CHILE
C;GO02; --;BHN;NORTH-SOUTH, MINA GUANACO, CHILE

Exploding Ice and Rock - Booms Heard a Result of "Cryoseisms"

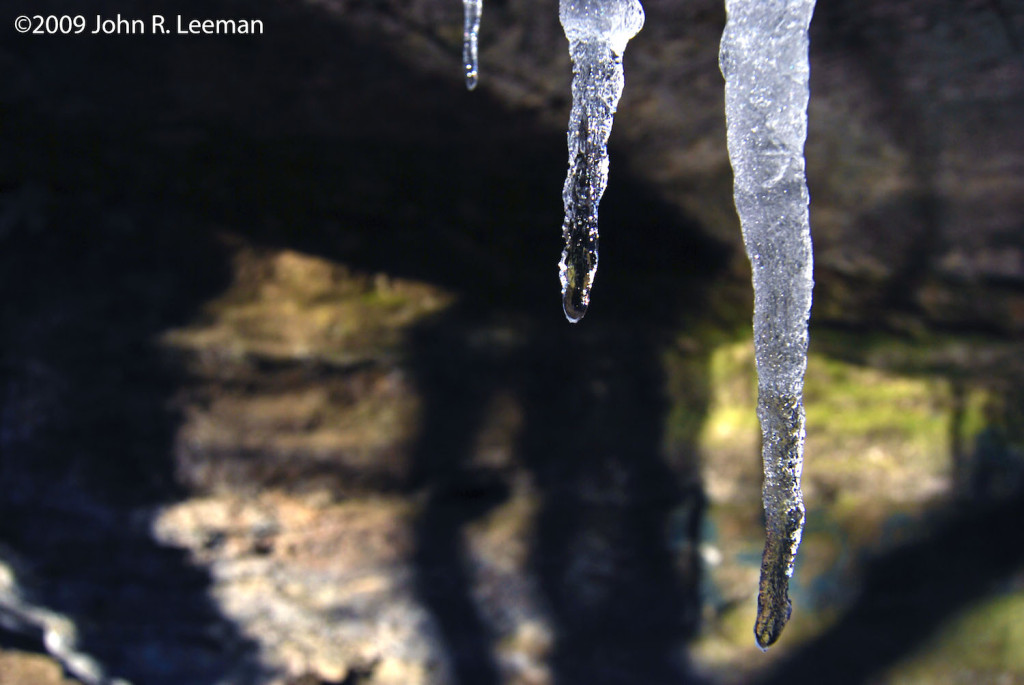
Ice Hanging From Rock

UPDATE 1/13/14: Frost-quake creates 100ft long crack here.

Over the past few days (starting around Christmas eve), there have been reports of large booming sounds associated with minor ground shaking across the northern states, as well as in Canada.  The Toronto events have a nice string of tweets that are associated with them as well.  Are these really explosions? Earthquakes? Sonic booms? The truth, as it turns out, is a rare event that produces what are known as "cryoseisms".  Oddly enough, these "frostquakes", as they are commonly known, have been discussed in the literature since about 1818!  Having a background in both meteorology and geophysics, cryoseisms are just one example of how closely related to two fields are.

So, what happens to produce such loud and potentially startling events? It's all about ice.  Cryoseisms occur when there are seasonal frost conditions, no insulating blanket of snow, lots of rain/thaw to saturate the ground, and a sharp drop in temperature.

Surface water penetrates into sufficiently permeable soil/rocks, but then is rapidly frozen with a fast drop in surface temperature.  Normally temperature drops slowly enough that the ice gradually freezes, giving the surrounding soil/rock time to adjust.  When really fast temperature drops occur and freezing is rapid, the surrounding areas are stressed by the expanding force of the ice.

The freezing process is actually a very powerful mechanism, and is one of the geologist's favorite ways to explain physical weathering of large boulders.  Freeze/thaw cycling has even been used as a quarrying technique in granite!

Expansion during this rapid freezing of infiltrated ground water stores energy in the surrounding rock/soil, like a spring, until..... BAM! Failure occurs in much the same way faults fail.  Here the driving force isn't tectonic though.

Cryoseisms can do light damage to structures in the immediate vicinity, but their intensity falls off very quickly with distance.  For the seismology buffs out there, the zero focal depth produces lots of surface waves, but these events are generally not recorded on seismic networks.

Want to know more about cryoseisms? The literature isn't too robust, but check out Barosh (2000), Nikonov (2010), and Voss & Herrmann (1980) for some starting points!

*Cryoseism is also used to refer to earthquakes at the base of glaciers as well.  That's a whole other story for another day!


April 2013 Oklahoma Earthquakes

This morning Oklahoma experienced another small sequence of earthquakes.  (There was also a large earthquake with an estimated magnitude of 7.8 in Iran over night.)  While I'm preparing for a conference very soon I'm a bit crunched for time, but thought a short post would be in order.  I would like to write a few posts concerning what magnitude is, how we calculate it, and other common questions I get asked at some point in the near future.

Okay, here's the synopsis of the most recent events. Early this morning at 01:56:29.875 CDT a magnitude 4.7 earthquake occurred centered northeast of the Oklahoma City metro area.  There have been a few significant aftershocks at magnitude 3.0, 3.6, and 4.6.  It is notable that there was a higher number of seismic events (though all small) beginning yesterday.  All these numbers are from the Oklahoma Geological Survey, the USGS estimates are lower with the largest events at 4.3, 4.2, and 3.3.  These magnitudes are computed on slightly different scales, but either way the largest earthquake released over 10 times LESS energy than the earthquakes last year.

The USGS did you feel it program has already collected around 1600 responses and the shaking reported matches very well with what was expected, probably due to the DYFI scale being pretty accurately calibrated after the large earthquake sequence last year.  It was striking that the vast majority of the responses came within 90 minutes of the quakes indicating the people actually got up and reported as soon as the event was over.  These responses really help the folks at the national earthquake information center (NEIC) and if you felt the earthquake but didn't go fill one out you should!

The moment tensor solution of the earthquake shows a strike slip solution meaning that the rock moved laterally past each other, not up and down.  This is shown by the "beachball" below with the colored regions indicating areas of compression.  There isn't enough information from one earthquake alone to tell if the fault runs SW to NE or SE to NW, but based upon the distribution of the large aftershocks it would be an okay initial guess that the fault trends to the NW.  Also notice the solution isn't perfectly strike-slip.  There is a small amount of oblique motion with a thrusting sense.  
After inspecting the infrasound instrument I have in my office I didn't see the earthquake, but the ground motion wasn't really detectable on the seismic station in Standing Stone, PA either.  It looks like the infrasound may have recorded the Iran earthquake, but I need to move it to a less noisy location.
Just for fun I've thrown in a seismograph below from a station in the Wichita Mountains in SW Oklahoma.  It would be fun to calculate the different arrivals and plot, but that's more fun for another time! I've made the trimmed .SAC file is available here in case you want to download it and try.

Oklahoma Earthquake - I felt it!

Those of us in Oklahoma this morning had quite a nice surprise when at about 9:06 AM local time the ground shook and many experienced an earthquake centered just outside of Norman, OK.  I live on the bottom floor of a 2-story apartment building and was standing when the quake hit.  I head a loud noise like a vehicle roll over, then felt the shake.  My blinds shook and a few plates rattled together.  After immediately realizing what it was I estimated the duration as about 15 seconds, but some of that could have been remnant swinging of objects in my house.  
The initial rating was 4.5 from the USGS (United States Geological Survey), and 5.1 from the OGS (Oklahoma Geological Survey).  These estimates have been revised many times over the day, as well as the location and depth of the quake.  The estimates seem to be settling around a 4.3-4.5 magnitude with a center just west of lake Thunderbird in Norman, OK.  Below is a google map (image: J. Leeman) plotting the OGS estimate of the center with the error as the shaded region.  This uncertainty is about 1.24mi in N/S and 1.12mi in E/W.  The USGS estimate is currently much less constrained, but subject to revision.  

 The earthquake was widely felt with reports from surrounding states.  If you felt the quake you should fill out the 'Did you Feel it?' question form available on the USGS website.  Many thousand reports have been submitted so far and data gathered from over 40 stations. The next image is courtesy of Bill Wilburn, planetarium director at the Science Museum of Oklahoma.  Following that is the plot of arrival times at different stations from Steve Piltz, Tulsa NWS.

 We are also fortunate to currently have the earthscope array stationed in Oklahoma.  The next figure shows current seismic stations on the OGS page.  The yellow stations are earthscope.  Those stations appear to have been saturated, but it could be a plotting issue.  I will not know until I can get ahold of the data.

The final two images are the Carlsbad, NM East Tower seismogram and a focal mechanism plot.  The Carlsbad plot just shows that the earthquake was still very detectable in NM and makes it easy to see why it was recorded by so many stations!  The focal mechanism plot (or moment tensor solution) plots the first movement (up/down) of the ground at the stations to determine the type of earthquake/fault.  Here we see evidence for a strike-slip fault along a SW-NE or SE-NW line.  Simply put this means the ground sheared on a horizontal plane, not shearing along a slanted/vertical face as in normal or transverse faults.  
I'll post more in a future post if we learn anything else significant from/about this quake.  Maybe also some neat arrival plots and a discussion of wave types.  As a note the largest earthquake recorded that originated in Oklahoma was in the El Reno area on April 9, 1952 with a magnitude of 5.5.  The USGS has the following to describe that quake:
This earthquake caused moderate damage at El Reno, Oklahoma City, and Ponca City, including toppled chimneys and smokestacks, cracked and loosened bricks on buildings, and broken windows and dishes. One crack in the State Capitol at Oklahoma City was 15 meters long. Slight damage was reported from many other towns in Oklahoma and from some towns in Kansas and Texas. The earthquake was caused by slippage along the Nemaha fault. Felt over most of Oklahoma and in Arkansas, Iowa, Kansas, Missouri, Nebraska, and Texas.