This past week I got to relive some of my favorite days of primary education: the science fair! A local elementary school was hosting their annual science fair and had asked the department to provide some demonstrations for the parents and students to see. I immediately volunteered our lab group and began to gather up the required materials. Some of the setups were made years ago by my advisor. I also developed a few and improved upon others here and there. I thought it would be fun to share the experience with you.
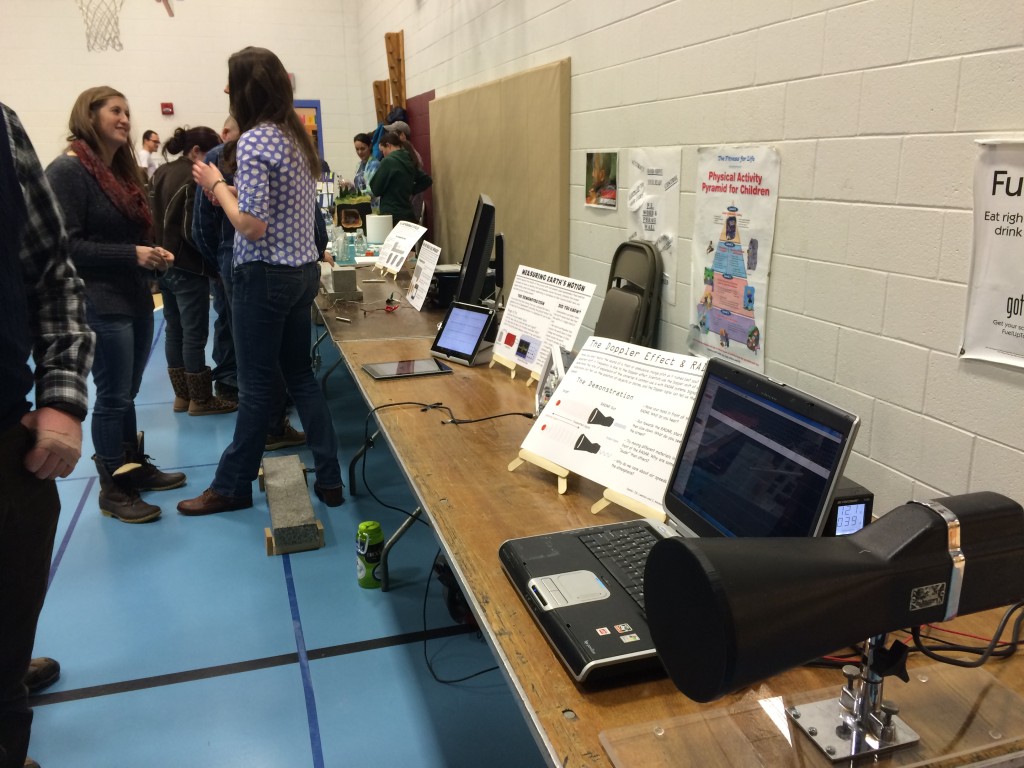
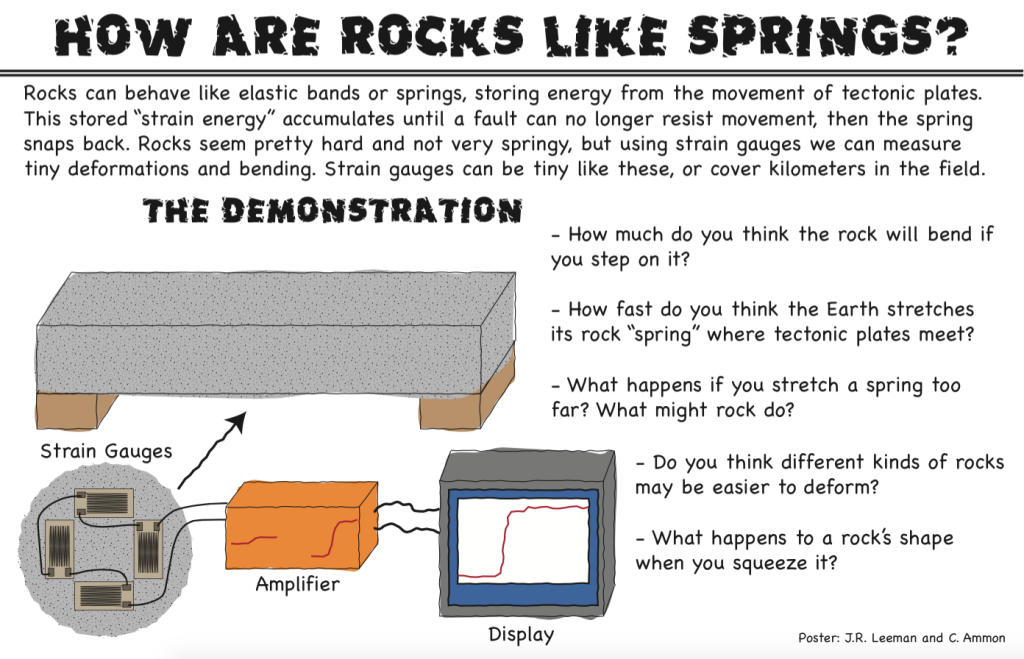
At some point, we should probably have a post or two about each of these demonstrations, but today we'll look at pictures and talk about the general feedback I received. First, off we had four demonstrations including the earthquake cycle, how rocks are like springs, seismometers, and Doppler RADAR. I made an 11x17" poster for each demo in Adobe Illustrator using a cartoon technique that one of our professors here shared with me.
For scientists, communicating with the public can be difficult. It's easy for us to get holed up in our little niche of work and forget that talking about a topic like power spectra isn't everyday to pretty much everyone. Outreach events like this present a great opportunity to work on those skills! This particular event was especially challenging for me because the children were K-5, much younger than I usually talk to. With high school students you can maybe talk about the frequency of a wave and not get too many lost looks, but not with grade-schoolers!
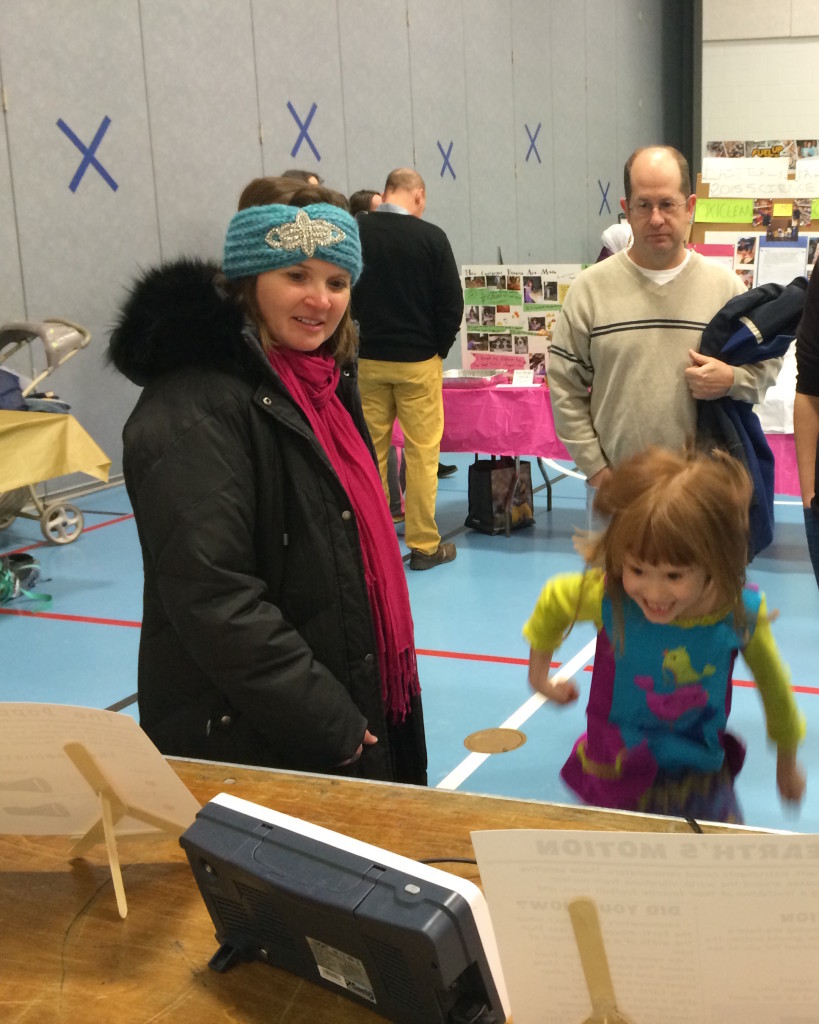
The other difficulty was adapting what are deep topics (each demo is an entire field of research, or several) to the short attention span we had to work with. Elementary school teachers are masters of this and I would love to get some ideas from them on how to work with the younger minds. I spent most of my time talking about the Doppler effect with the RADAR (it's the topic my lab mates were least comfortable with since we don't deal with RADAR at work generally). By the end of the science fair, I had an explanation down that involved asking the kids to wave their hand slowly and quickly in front of the RADAR and listen to how the pitch of the output changed. Comparing that to the classic example of the pitch bending of a passing fire truck siren seemed to work pretty well. I had a "waterfall" spectra display that showed the measured velocity with time, but other than trying to get the line to go higher than their friends, it didn't get much science across (though lots of healthy competition and physical exercise was encouraged).
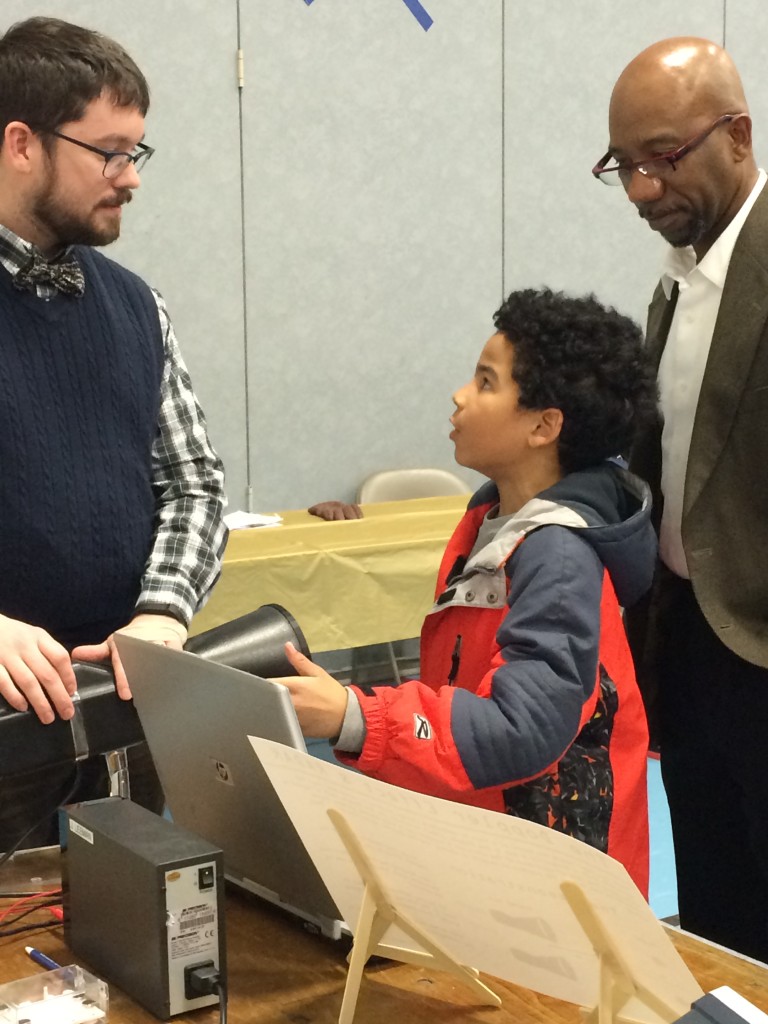
In the past, I've pointed out the value of being an "expert generalist". All of us were tested in any possible facet of science by questions from the kids and their parents. I ended up discussing gravitational sling-shot effects on space probes with a student and his parents who were incredibly interested in spaceflight. I also got quizzed about why the snow forecasts had been so bad lately, when the next big earthquake would be, and a myriad of other questions. Before talking to any public group, it's also good to make sure you are relatively up-to-date on current events, general theory, and are ready to critically think about questions that sound deceptively simple!
The last point I want to bring up today is the idea of comparisons. These are numbers that one of my committee members likes to say he "carries around in his shirt pocket." These are numbers that let us, as scientists, relate to others that are non-specialists and give us some physical attachment to a measurement. What do I mean? Let's say that I tell you that tectonic plates move anywhere from 2-15 cm/year. Great, first, since we are in the U.S.A., everyone will hold out their fingers to try to get an idea of what this means in imperial units.... not quite 1-6 in/year. That's better, but a year is a long time and I can't really visualize moving that slowly since nothing I'm used to seeing everyday is that slow... or is it? Turns out that fingernails, on average, grow 3.6 cm/year and hair grows about 15 cm/year. Close enough! In Earth science we have lots of approximate numbers, so these tiny differences are not really that bad. Now let's revise our statement to the kids to say: "The Earth is made of big blocks of rock called plates. These move around at about the speed your finger nails or hair grow!" Now it is something that anyone can relate to, and next time they clip their nails or get a hair cut, they just might remember something about plate tectonics! It's not about having exact figures in the minds of everyone, it's about providing a hand-hold that anybody can relate to! This deserves a post to itself though.
That's all for now, but I'd love to hear back from anyone who has elementary education experience or has their own "shirt pocket numbers."

